MLL4-associated condensates counterbalance Polycomb-mediated nuclear mechanical stress in Kabuki syndrome - PubMed (original) (raw)
. 2020 Dec;52(12):1397-1411.
doi: 10.1038/s41588-020-00724-8. Epub 2020 Nov 9.
Sarah D'Annunzio # 3, Vittoria Poli # 3, Luca Fagnocchi 3, Sven Beyes 3, Daniela Michelatti 3, Francesco Corazza 3, Laura Antonelli 4, Francesco Gregoretti 4, Gennaro Oliva 4, Romina Belli 3, Daniele Peroni 3, Enrico Domenici 3 5, Samuel Zambrano 6 7, Daniela Intartaglia 8, Carmine Settembre 8 9, Ivan Conte 8 10, Claudia Testi 11, Panagiotis Vergyris 11, Giancarlo Ruocco 11, Alessio Zippo 12 13
Affiliations
- PMID: 33169020
- PMCID: PMC7610431
- DOI: 10.1038/s41588-020-00724-8
MLL4-associated condensates counterbalance Polycomb-mediated nuclear mechanical stress in Kabuki syndrome
Alessandra Fasciani et al. Nat Genet. 2020 Dec.
Abstract
The genetic elements required to tune gene expression are partitioned in active and repressive nuclear condensates. Chromatin compartments include transcriptional clusters whose dynamic establishment and functioning depend on multivalent interactions occurring among transcription factors, cofactors and basal transcriptional machinery. However, how chromatin players contribute to the assembly of transcriptional condensates is poorly understood. By interrogating the effect of KMT2D (also known as MLL4) haploinsufficiency in Kabuki syndrome, we found that mixed lineage leukemia 4 (MLL4) contributes to the assembly of transcriptional condensates through liquid-liquid phase separation. MLL4 loss of function impaired Polycomb-dependent chromatin compartmentalization, altering the nuclear architecture. By releasing the nuclear mechanical stress through inhibition of the mechanosensor ATR, we re-established the mechanosignaling of mesenchymal stem cells and their commitment towards chondrocytes both in vitro and in vivo. This study supports the notion that, in Kabuki syndrome, the haploinsufficiency of MLL4 causes an altered functional partitioning of chromatin, which determines the architecture and mechanical properties of the nucleus.
Conflict of interest statement
Competing Interests Statement
The authors declare no competing interests.
Figures
Extended Data Fig. 1
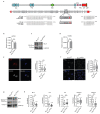
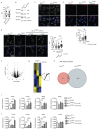
a Schematic representation of KMT2D gene and the corresponding MLL4 protein. The position of the inserted mutations in exon 39 and the relative changes in the coding sequences are highlighted. b qRT-PCR of KMT2D in WT and MLL4Q4092X MSCs, normalized on GAPDH level. Data are means + SEM (n=3 independent experiments); unpaired two-tailed Student’s _t_-test was applied for statistical analysis. c Western Blot analysis of MLL4 protein in WT and MLL4Q4092X MSCs by using a specific antibody recognizing a central portion of the protein; Lamin B1 was used as loading control. d qRT-PCR of KDM6A in WT and MLL4Q4092X MSCs, normalized on GAPDH level. Data are means + SEM (n=3 independent experiments); unpaired two-tailed Student’s _t_-test was applied for statistical analysis. e Representative images and quantifications of immunostaining for MLL4 in WT and MLL4Q4092X MSCs grown on the same coverslips. WT MSCs were pre-labelled with CellTrace Violet.Scale bar, 20 μm. Box plots indicate the median (middle line), the first and third quartiles (box), and the 10th and 90th percentile (error bars) of the fluorescence intensity. The number of analyzed nuclei is reported in figure as n; Student’s two-tailed unpaired t-test was applied for statistical analysis. f Representative images and quantifications of immunostaining for PA1 in WT and MLL4Q4092X MSCs. Scale bar, 20 μm. Box plots indicate the median (middle line), the first and third quartiles (box), and the 10th and 90th percentile (error bars) of the fluorescence intensity. The number of analyzed nuclei is reported in figure as n; unpaired two-tailed Student’s _t_-test was applied for statistical analysis. g Western Blot analysis of MLL4 and UTX in WT and MLL4P4093X MSCs; Lamin B1 was used as loading control (n=1). h Quantifications of immunostaining for MLL4, PA1, UTX, H3K4me1 and H3K27ac in WT and MLL4P4093X MSCs. Box plots indicate the median (middle line), the first and third quartiles (box), and the 10th and 90th percentile (error bars) of the fluorescence intensity. The number of analyzed nuclei is reported in figure as n; Student’s two-tailed unpaired _t_-test was applied. for statistical analysis (****P<0.0001).
Extended Data Fig. 2
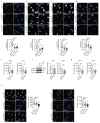
a-d Representative images and quantifications of immunostaining for MLL4 (a), H3K4me1 (b), H3K27ac (c) and UTX (d) in primary fibroblasts from healthy donor or Kabuki patients. Scale bar, 20 μm. Box plots indicate the median (middle line), the first and third quartiles (box), and the 10th and 90th percentile (error bars) of the fluorescence intensity. The number of analyzed nuclei is reported in figure as n; unpaired two-tailed Student’s _t_-test was applied for statistical analysis (****P<0.0001). e Quantifications of immunostaining for BRD4 and MED1 in WT and MLL4Q4092X MSCs grown on the same coverslips. WT MSCs were pre-labelled with CellTrace Violet Scale bar, 20 μm. Box plots indicate the median (middle line), the first and third quartiles (box), and the 10th and 90th percentile (error bars) of the fluorescence intensity. The number of analyzed nuclei is reported in figure as n; unpaired two-tailed Student’s _t_-test was applied for statistical analysis. f Western Blot analysis of BRD4 and MED1 in WT and MLL4Q4092X MSCs; histone H3 was used as loading control. Signal quantifications are reported as bar plots. Data are means + SEM of 4 independent experiments for BRD4 and 5 independent experiments for MED1; one-tailed Student’s t-test was applied for statistical analysis. g-i Representative images and quantifications of cluster intensity for BRD4 and MED1 immunostaining in WT and MLL4P4093X MSCs (g) on in primary fibroblasts from healthy donor or Kabuki patients (h-i). Box plots indicate the median (middle line), the first and third quartiles (box), and the 10th and 90th percentile (error bars) of the fluorescence intensity. The number of analyzed nuclei is reported in figure as n; unpaired two-tailed Student’s _t_-test was applied for statistical analysis (****P<0.0001).
Extended Data Fig. 3
a-b Representative images and 3D reconstruction of the distribution of BRD4 (a) and MED1 (b) clusters in WT and MLL4Q4092X MSCs; Scale bar, 20 μm. Quantification of the number of BRD4 and MED1 clusters in WT and MLL4Q4092X MSCs. Box plots indicate the median (middle line), the first and third quartiles (box), and the 10th and 90th percentile (error bars). The number of analyzed nuclei is reported in figure as n; unpaired two-tailed Student’s _t_-test was applied for statistical analysis. c Graphical representation of the experimental design adopted to measure the clustering of the MED1-IDR tagged with mCherry and fused to the Cry2 module. A single blue light stimulation (488nm, 50% light intensity, 2 seconds) was applied (green bars) followed by acquisition of mCherry signal (red bars). d Quantification of the fluorescence intensity of MED1-IDR, measured in WT (n=39) and MLL4Q4092X (n=47) MSCs at the indicated time points. Box plots indicate the median (middle line), the first and third quartiles (box), and the 10th and 90th percentile (error bars) of the fluorescence intensity. The number of analyzed nuclei is reported in figure as n; unpaired two-tailed Student’s _t_-test was applied for statistical analysis. e Representative images of light-stimulated MSCs expressing the mCherry-Cry2 construct, at different time points; scale bar, 10 μm. f Representative images of light-induced clustering of MED1-IDR in MSCs, after a single pulse of stimulation (2 seconds, 488mn wavelength), stained for MLL4 and BRD4; scale bar, 10 μm. Pearson coefficient between MED-IDR and MLL4 or BRD4 was determined. Box plots indicate the median (middle line), the first and third quartiles (box), and the 10th and 90th percentile (error bars) of the fluorescence intensity. The number of analyzed nuclei is reported in figure as n.
Extended Data Fig. 4
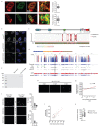
a Representative images of dual immunostaining for MLL4 and BRD4 or MED1 in WT MSCs; scale bar, 10 μm. Asterisks indicate Golgi aspecific signal. Pearson coefficient between MLL4 and BRD4 or MED1 was determined. Box plots indicate the median (middle line), the first and third quartiles (box), and the 10th and 90th percentile (error bars). The number of analyzed nuclei is reported in figure as n. b Representative images of immunostaining for MLL4 in WT MSCs, and in cells carrying KMT2D truncating mutation on one (MLL4Q4092X/WT) or both alleles (MLL4Q4092X/Q4092X). c Graphical representation of the Prion-like amino acid composition of MLL4 retrieved by PLAAC analysis. d Analyses on the KMT2D gene showing the constrained coding regions (CCR), the known clinical variants (clinVar), the protein changing variants, and the conservation pattern (GERP). The square indicates the genomic regions codifying for the MLL4-PrLD. e SDS-PAGE and Coomassie staining of purified MLL4-PrLD and MLL4-PrLDΔQ recombinant proteins. f Phase separation of MLL4-PrLD recombinant protein visualized and quantified by fluorescence microscopy, in presence of increasing concentration of NaCl or 1,6-hexanediol; scale bar 5 μm. g Phase separation of MLL4-PrLDΔQ at different protein concentrations; scale bar 5 μM. h Measurements of the relative amount of condensed MLL4-PrLDΔQ versus protein concentration. Red line represents the regression line. i Measurements of the number of formed MLL4-PrLD clusters versus the expression level in NIH3T3 cells. The quantification is the result of three independent experiments. Red line represents the regression line. j Measurement of the mean fluorescent intensity in NIH3T3 cells expressing the OptoMLL4-PrLD or the OptoMLL4-PrLDΔQ, respectively. Box plots indicate the median (middle line), the first and third quartiles (box), and the 10th and 90th percentile (error bars) of the fluorescence intensity. The number of analyzed nuclei is reported in figure as n. Unpaired two-tailed Student’s _t_-test was applied for statistical analysis.
Extended Data Fig. 5
a Western Blot analysis of EED, EZH2 and SUZ12 in WT and MLL4Q4092X MSCs; histone H3 was used as loading control. b qRT-PCR of BMI and RING1B in WT and MLL4Q4092X MSCs, normalized on GAPDH level. Data are means + SEM (n=3 independent experiments); unpaired two-tailed Student’s _t_-test was applied for statistical analysis. c Quantifications of immunostaining for H3K27me3, BMI, and RING1B in WT and MLL4P4093X MSCs. Box plots indicate the median (middle line), the first and third quartiles (box), and the 10th and 90th percentile (error bars) of the fluorescence intensity. The number of analyzed nuclei is reported in figure as n; unpaired two-tailed Student’s _t_-test was applied for statistical analysis (****P<0.0001). d-f Representative images and quantifications of immunostaining for H3K27me3 (d), BMI (e), and RING1B (f) in primary fibroblasts from healthy donor or Kabuki patients; scale bar, 20 μm. Box plots indicate the median (middle line), the first and third quartiles (box), and the 10th and 90th percentile (error bars) of the fluorescence intensity. The number of analyzed nuclei is reported in figure as n; unpaired two-tailed Student’s _t_-test was applied for statistical analysis (****P<0.0001). g qRT-PCR of KMT2D in WT and MLL4Q4092X MSCs, expressing CRISPRa with or without crRNA targeting KMT2D promoter. Retrieved data were normalized on GAPDH level. Data are means + SEM (n=4 independent experiments); unpaired two-tailed Student’s _t_-test was applied for statistical analysis. h-i Quantifications of immunostaining for MLL4, H3K4me1, BMI, RING1B and H3K27me3 in WT and MLL4Q4092X MSCs expressing CRISPRa with or without crRNA targeting KMT2D promoter. Box plots indicate the median (middle line), the first and third quartiles (box), and the 10th and 90th percentile (error bars) of the normalized fluorescence intensity. The number of analyzed nuclei is reported in figure as n; Student’s two-tailed unpaired _t_-test was applied for statistical analysis (****P<0.0001).
Extended Data Fig. 6
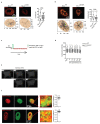
a-b Reconstructed 3D images of nuclei retrieved from images of WT and MLL4P4093X MSCs (a) or primary fibroblasts from healthy donor and Kabuki patients (b). Scale bar, 5 μm. The nuclear area, volume and flattening were determined and represented as box plots indicating the median (middle line), the first and third quartiles (box), and the 10th and 90th percentile (error bars). The number of analyzed nuclei is reported in figure as n; unpaired two-tailed Student’s _t_-test was applied for statistical analysis (****P<0.0001). c Measurements of nuclear shape in WT and MLL4Q4092X MSCs expressing CRISPRa with or without crRNA targeting KMT2D promoter. The nuclear area, volume and flattening were represented as box plots indicating the median (middle line), the first and third quartiles (box), and the 10th and 90th percentile (error bars). The number of analyzed nuclei is reported in figure as n; unpaired two-tailed Student’s _t_-test was applied for statistical analysis (****P<0.0001). d qRT-PCR of LMNA in WT and MLL4Q4092X MSCs, normalized on GAPDH level. Data are means + SEM (n=3 independent experiments); unpaired two-tailed Student’s _t_-test was applied for statistical analysis. e Quantifications of immunostaining for LMNA and phosphorylated LMNA/C (pLMNA) in WT and MLL4P4093X MSCs. Box plots indicate the median (middle line), the first and third quartiles (box), and the 10th and 90th percentile (error bars) of the fluorescence intensity. The number of analyzed nuclei is reported in figure as n; unpaired two-tailed Student’s _t_-test was applied for statistical analysis (****P<0.0001). f-g Representative images and quantifications of cellular area detected by Phalloidin staining in WT and MLL4Q4092X MSCs (f) or in the same cells expressing either EGFP or EGFP-Nesprin-KASH (g). Scale bar, 20 μm. Box plots indicate the median (middle line), the first and third quartiles (box), and the 10th and 90th percentile (error bars) of the cellular area. The number of analyzed cells is reported in figure as n; unpaired two-tailed Student’s _t_-test was applied for statistical analysis (****P<0.0001). h-i Representative images and quantifications of immunostaining for H4K16ac in WT and MLL4P4093X MSCs (h) or in WT primary fibroblasts from healthy donor or Kabuki patients (i). Box plots indicate the median (middle line), the first and third quartiles (box), and the 10th and 90th percentile (error bars) of the normalized fluorescence intensity. The number of analyzed nuclei is reported in figure as n; unpaired two-tailed Student’s _t_-test was applied for statistical analysis (****P<0.0001).
Extended Data Fig. 7
a-b Representative images and quantifications of immunostaining for H3K27me3 (a) and BMI (b) in WT and MLL4Q4092X MSCs untreated or treated with TSA (1.5 μM for 8h). Scale bar, 20 μm. Box plots indicate the median (middle line), the first and third quartiles (box), and the 10th and 90th percentile (error bars) of the normalized fluorescence intensity. The number of analyzed nuclei is reported in figure as n; unpaired two-tailed Student’s _t_-test was applied for statistical analysis (****P<0.0001). c Representative images and quantification of immunostaining for H3K27me3 in WT, MLL4Q4092X or MLL4Q4092X MSCs expressing either H3.3WT or H3.3K27M. Scale bar, 20 μm. Box plots indicate the median (middle line), the first and third quartiles (box), and the 10th and 90th percentile (error bars) of the normalized fluorescence intensity. The number of analyzed nuclei is reported in figure as n; unpaired two-tailed Student’s _t_-test was applied for statistical analysis (****P<0.0001). d Representative maps of stiffness distribution in WT, MLL4Q4092XMSCs, MLL4Q4092X MSCs expressing H3.3K27M or MLL4Q4092X MSCs treated with TSA for 24h; Scale bars, 10 μm. Bar plot representing nuclear Brillouin shift in the different conditions. Data are means + SEM (n=4 independent experiments); unpaired two-tailed Student’s _t_-test was applied for statistical analysis (****P<0.0001).
Extended Data Fig. 8
a Quantification of the number and the area of the light-induced droplets of BMI-Cry2 at different time points. First panel shows the distribution changes in the time window of 300 seconds post-stimulation. Second panel shows the formation and disassembly of BMI-Cry2 clusters within a time window of 35 minutes. b Quantification of the relative frequency of small (<0.1μm2) and large (>0.1μm2) droplets of BMI-Cry2 at different time points. c Representative images of dual immunostaining for BMI1 and RING1B (upper panels) or H3K27me3 (middle panels) or BRD4 (lower panels) in WT MSCs; scale bar, 10 μm. Pearson coefficient was represented as box plots, indicating the median (middle line), the first and third quartiles (box), and the 10th and 90th percentile (error bars). The number of analyzed nuclei is reported in figure as n. d Representative images of immunostaining for H3K27me3 and RING1B in NIH3T3 expressing BMI-Cry2, after light-induced clustering, Scale bar, 10 μm. Pearson Coefficient between BMI-Cry2 and H3K27me3 or RING1B was represented as box plots indicating the median (middle line), the first and third quartiles (box), and the 10th and 90th percentile (error bars). The number of analyzed nuclei is reported in figure as n.
Extended Data Fig. 9
a Quantifications of immunostaining for YAP/TAZ in WT and MLL4P4093X MSCs. Box plots indicate the median (middle line), the first and third quartiles (box), and the 10th and 90th percentile (error bars). The number of analyzed nuclei is reported in figure as n; unpaired two-tailed Student’s t-test was applied for statistical analysis (****P<0.0001). **b** Western Blot analysis of YAP, TAZ and phosphorylated YAP (Ser127) in WT and MLL4Q4092X MSCs; GAPDH was used as loading control. **c** Representative images of the distribution of ATR in WT and MLL4Q4092X MSCs. Scale bar, 20 μm. **d** Representative images and quantifications of immunostaining for YAP/TAZ in WT and MLL4Q4092X MSCs untreated or treated with different concentrations of the ATR inhibitor VE-822. Scale bar, 20 μm. Data are represented as box plots, indicating the median (middle line), the first and third quartiles (box), and the 10th and 90th percentile (error bars). The number of analyzed nuclei is reported in figure as n; unpaired two-tailed Student’s _t_-test was applied for statistical analysis (****P<0.0001). **e** Representative images and quantification of phH2A.X in WT and MLL4Q4092X MSCs. Scale bar, 20 μm. Box plots indicate the median (middle line), the first and third quartiles (box), and the 10th and 90th percentile (error bars) of the phH2A.X distribution per cell. The number of analyzed nuclei is reported in figure as n; unpaired two-tailed Student’s _t_-test was applied for statistical analysis. **f** Volcano plot of differentially expressed genes between WT and MLL4Q4092X MSCs. Vertical blue lines indicate the chosen cutoff (−2>fold change>2), horizontal red line indicates Wald test-derived p-value cutoff of 0.05. g Heat map of k-means clustering analysis of expressed genes in WT MSCs untreated or treated with ATR inhibitor at the indicated time points. h Venn diagram showing the overlap between the ATR responsive genes identified in WT and MLL4Q4092X MSCs. i qRT-PCR of the indicated genes in WT, MLL4Q4092X (i) and MLL4P4093X MSCs (k) untreated or treated with ATR inhibitor at the different time points. The expression level was normalized on GAPDH level. Data are means + SEM (n=3 independent experiments); unpaired two-tailed Student’s _t_-test was applied for statistical analysis (***P<0.001).
Extended Data Fig. 10
a qRT-PCR of chromatin architecture genes in WT and MLL4Q4092X MSCs expressing CRISPRa with or without crRNA targeting KMT2D promoter. Retrieved data were normalized on GAPDH level. Data are means + SEM (n=3 independent experiments); unpaired two-tailed Student’s _t_-test was applied for statistical analysis. b-c Quantifications of immunostaining for YAP/TAZ in WT and MLL4Q4092X MSCs expressing CRISPRa with or without crRNA targeting KMT2D promoter (b) or in WT and MLL4Q4092X MSCs expressing either H3.3WT or H3.3K27M.(c). Box plots indicate the median (middle line), the first and third quartiles (box), and the 10th and 90th percentile (error bars). The number of analyzed nuclei is reported in figure as n; unpaired two-tailed Student’s t-test was applied for statistical analysis (****P<0.0001). d Differentiation of WT and MLL4Q4092X MSCs into adipocytes, osteocytes or chondrocytes were detected was detected by Oil red, Alizarin red or by Alcian blue staining, respectively. Scale bar, 100 μm. e qRT-PCR of the indicated genes during differentiation of WT and MLL4Q4092X MSCs towards chondrocytes. The expression level was normalized on GAPDH level. Data are means + SEM (n=3 independent experiments); unpaired two-tailed Student’s _t_-test was applied for statistical analysis. f Chondrogenic differentiation of WT and MLL4Q4092X MSCs or MLL4Q4092X MSCs expressing exogenous MLL4 was detected by Alcian blue staining. Scale bar, 500 μm. g Bar plot of the relative quantification of Ethmoid plate (EP), Palatoquadrate (PQ), Ceratohyal (CH) and Ceretobranchials 1 to 5 (CBs) cartilage length in Ctrl, _KMT2D 5’UTR_-morpholino and _KMT2D 5’UTR_-morpholino-treated with ATR inhibitor. Data are means + SEM (n=10 animals; n=12 animals for CH quantification in the KMT2D morphants); two-tailed Student’s _t_-test was applied for statistical analysis (****P<0.0001). h Bar plot of the relative quantification of Palatoquadrate (PQ), Ceratohyal (CH), Operculum (OP), Cleithrum (CL) and fifth ceratobranchial (CB) cartilage length in _KMT2D 5’UTR_-morpholino and ATRi-treated _KMT2D 5’UTR_-morpholino medaka fish. ata are means + SEM (n=10 animals); two-tailed Student’s _t_-test was applied for statistical analysis (****P<0.0001). k Bar plot of the relative quantification of Palatoquadrate (PQ), Ceratohyal (CH), Operculum (OP), Cleithrum (CL) and fifth ceratobranchial (CB) mineralization in _KMT2D 5’UTR_-morpholino and ATRi-treated _KMT2D 5’UTR_-morpholino medaka fish. Data are means + SEM (n=10 animals); two-tailed Student’s _t_-test was applied for statistical analysis (****P<0.0001).
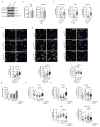
Fig. 1. KMT2D loss-of-function destabilizes MLL4/COMPASS complex activity
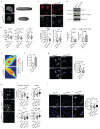
a Western Blot analysis of MLL4/COMPASS complex in WT and MLL4Q4092X MSCs by using the indicated antibodies; Lamin B1 was used as loading control. Serial dilutions of protein extracts were loaded. Signal quantifications for MLL4 and UTX are reported as barplot. Data are means + SEM of 4 independent experiments; one-tailed Student’s _t_-test was applied for statistical analysis. b-c Representative images and relative quantifications of immunostaining for MLL4 (b) and UTX (c) in WT and MLL4Q4092X MSCs. Scale bar, 25 μm. Box plots indicate the median (middle line), the first and third quartiles (box), and the 10th and 90th percentile (error bars) of the fluorescence intensity of analyzed nuclei (n), as reported in figure. Unpaired two-tailed Student’s _t_-test was applied for statistical analysis (**** P < 0.0001). d Relative abundance of H3K4 modifications in WT and MLL4Q4092X MSCs by MS analyses. The large pies represent the average abundance of H3K4me1 and the unmodified H3K4, with respect to the total histone H3. The small pies represent the average abundance of H3K4me2 and H3K4me3, with respect to the total histone H3. The relative quantifications were determined using four biologically independent samples. e Relative abundance of H3K27 acetylation in WT and MLL4Q4092X MSCs measured by MS analyses. Data are means + SEM (n = 4 biologically independent samples); unpaired two-tailed Student’s _t_-test was applied for statistical analysis f-g Representative images and relative quantifications of immunostaining for H3K4me1 (f) and H3K27ac (g) in WT and MLL4Q4092X MSCs. Scale bar, 20 μm Box plots indicate the median (middle line), the first and third quartiles (box), and the 10th and 90th percentile (error bars) of the fluorescence intensity of analyzed nuclei (n), as reported in figure. Unpaired two-tailed Student’s _t_-test was applied for statistical analysis (**** P < 0.0001).
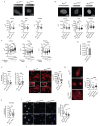
Fig. 2. Effects of MLL4 LoF on clustering of transcriptional biomolecular condensates
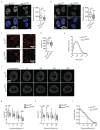
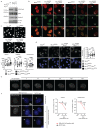
a-b Representative images and relative quantifications of cluster intensities for BRD4 (a) and MED1 (b) immunostaining in WT and MLL4Q4092X MSCs. Scale bar, 10 μm. Box plots indicate the median (middle line), the first and third quartiles (box), and the 10th and 90th percentile (error bars) of the fluorescence intensity of analyzed nuclei (n), as reported in figure. Unpaired two-tailed Student’s _t_-test was applied for statistical analysis (**** P < 0.0001). c Representative STORM images of BRD4 in WT and MLL4Q4092X MSCs of three independent experiments; scale bar, 5 μm. Zoom in images highlighting the clustered distribution of the signal; scale bar, 1 μm. d Quantification of the number of BRD4 clusters, measured in individual nuclei of WT and MLL4Q4092X MSCs. Box plots indicate the median (middle line), the first and third quartiles (box), and the 10th and 90th percentile (error bars) of the fluorescence intensity. n = 25 nuclei analyzed/sample over three independent experiments; unpaired two-tailed Student’s _t_-test was applied for statistical analysis. e Distribution of the area of the BRD4 clusters detected in WT and MLL4Q4092X MSCs. f Representative images of five independent experiments of blue light-induced clustering of MED1-IDR at the indicated time points, in WT and MLL4Q4092X MSCs; scale bar, 5 μm. g Quantification of the number of MED1-IDR clusters, measured in individual nuclei of WT (n = 32) and MLL4Q4092X (n = 25) MSCs at the indicated time points. Box plots indicate the median (middle line), the first and third quartiles (box), and the 10th and 90th percentile (error bars); unpaired two-tailed Student’s _t_-test was applied for statistical analysis. h Quantification of the distribution of the area of MED1-IDR clusters, measured in individual nuclei of WT (n = 32) and MLL4Q4092X (n = 25) MSCs at the indicated time points. Box plots indicate the median (middle line), the first and third quartiles (box), and the 10th and 90th percentile (error bars); unpaired two-tailed Student’s _t_-test was applied for statistical analysis. i Distribution of the normalized area of MED1-IDR clusters, measured in individual nuclei of WT and MLL4Q4092X MSCs. The area of each cluster/time point was normalized versus the corresponding area measured at the first time point post stimulation (T = 0). Dashed lines represent the corresponding time life of MED1-IDR.
Fig. 3. MLL4 is clustered in transcriptional condensates through its PrLD
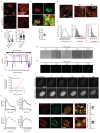
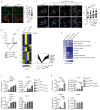
a Representative image of immunostaining for MLL4 in WT and MLL4Q4092X MSCs. Scale bar, 10 μm. Zoom in of the indicated portion of the image, highlighting the clustered distribution of MLL4; scale bar, 5 μm. b Representative images of dual immunostaining for MLL4 and RNA Pol II, in WT MSCs; scale bar, 10 μm. Pearson Coefficient between MLL4 and RNA Pol II was represented as a box indicating the median (middle line), the first and third quartiles (box), and the 10th and 90th percentile (error bars); number of analyzed nuclei n = 59. c Quantification of the number and the size of MLL4 clusters in individual nuclei of WT (n = 200) and MLL4Q4092X (n = 332) MSCs, resolved by 3D confocal scanning microscopy. Box plots indicate the median (middle line), the first and third quartiles (box), and the 10th and 90th percentile (error bars). Unpaired two-tailed Student’s _t_-test was applied for statistical analysis (**** P < 0.0001). d Representative STORM images of MLL4 in WT MSCs; scale bar, 5 μm. Zoom in of the images highlighting the clustered distribution of the signal; scale bar, 2 μm. e Representative distribution of the area of the MLL4 clusters detected in WT MSCs. Analysis of the number of localizations in each cluster of MLL4; enlarged picture highlights the occurrence of localizations for the largest MLL4 clusters. f Graphical representation of the predicted intrinsically disorder regions (IDRs) of MLL4 retrieved by PONDR analysis. g-h Phase separation of MLL4-PrLD at the physiological salt concentration detected by differential interference contrast (DIC) (g) or fluorescence microscopy (h), using increasing concentration of the mCherry-tagged recombinant protein; scale bar, 5 μm. i Measurements of the relative amount of condensed MLL4 PrLD versus protein concentration. X-axis showing the different MLL4 protein concentrations. Values on Y-axis represent the ratio of liquid-liquid phase-separated protein. Regression line is shown in red. j Representative images of blue light-induced clustering of MLL4-PrLD and MLL4-PrLDΔQ at different time points in NIH 3T3 cells. Cells were stimulated for 2 seconds with 488-nm light followed by image acquisition every 15 seconds. Number of analyzed cells n = 17 over two independent experiments; scale bar, 10 μm. k Quantification of the number and the area of the light-induced droplets of MLL4-PrLD at different time points; lower panels show the pre-stimulation and the initial time frames post-light stimulation. l Representative images of immunostaining for BRD4 and MED1 after light-induced clustering of MLL4-PrLD; scale bar: 5 μm. Zoom-in images show the distribution pattern of MLL4 droplets with respect to the signal of BRD4 and MED1; scale bar: 5 μm. Pearson Coefficient between MLL4_IDR and BRD4 (n = 31) or Med1 (n = 28) was represented as box plot indicating the median (middle line), the first and third quartiles (box), and the 10th and 90th percentile (error bars).
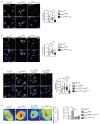
Fig. 4. Polycomb clustering is affected by MLL4 LoF
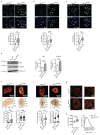
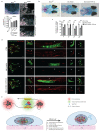
a-c Representative images and relative quantifications of immunostaining for H3K27me3 (a), BMI (b) and RING1B (c) in WT and MLL4Q4092X MSCs. Scale bar, 10 μm. Box plots indicate the median (middle line), the first and third quartiles (box), and the 10th and 90th percentile (error bars) of the fluorescence intensity of analyzed nuclei (n), as reported in figure. Unpaired two-tailed Student’s _t_-test was applied for statistical analysis (**** P < 0.0001). d Western Blot analysis of BMI1 and RING1B in WT and MLL4Q4092X MSCs; histone H3 was used as loading control. Signal quantification for BMI and RING1B is reported. Data are means + SEM of 3 independent experiments; unpaired one-tailed Student’s _t_-test was applied for statistical analysis. e-f Representative images of the distribution of BMI (e) and RING1B (f) clusters within the nuclear volume of WT and MLL4Q4092X MSCs (upper panel); scale bar, 10 μm. 3D reconstruction of the positioning of BMI and RING1B clusters with respect to the nuclear centroid (middle panel). Quantification of the number and volumes of BMI and RING1B clusters in individual nuclei of WT and MLL4Q4092X MSCs. Box plots indicate the median (middle line), the first and third quartiles (box), and the 10th and 90th percentile (error bars) of the fluorescence intensity of analyzed nuclei (n) as reported in figure. Unpaired two-tailed Student’s _t_-test was applied for statistical analysis (**** P < 0.0001). g Representative STORM images of RING1B in WT and MLL4Q4092X MSCs; scale bar, 5 μm. Zoom-in on the indicated portion of the images inside the red square, highlighting the clustered distribution of Polycomb protein; scale bar, 1 μm. h Analysis of the number of RING1B clusters measured in WT and MLL4Q4092X MSCs (left panel). Box plots indicate the median (middle line), the first and third quartiles (box), and the 10th and 90th percentile (error bars) of the clusters/nucleus; analyzed independent nuclei/sample n = 10. Representative distribution of the area of the RING1B clusters detected in WT and MLL4Q4092X MSCs (right panel); unpaired two-tailed Student’s _t_-test was applied for statistical analysis.
Fig. 5. MLL4 contributes to establish nuclear mechanical properties
a High magnification images of nuclei of WT and MLL4Q4092X MSCs and reconstructed 3D images of nuclear shape. Scale bar, 5 μm. b Quantification of nuclear volume, nuclear area and flatness of WT and MLL4Q4092X MSCs. Box plots indicate the median (middle line), the first and third quartiles (box), and the 10th and 90th percentile (error bars). The number of analyzed nuclei is reported in figure (n). Unpaired two-tailed Student’s _t_-test was applied for statistical analysis (**** P < 0.0001). c Representative images and relative quantifications of immunostaining for LMNA/C and LMNA/C phosphorylated on Ser22 (pLMNA) in WT and MLL4Q4092X MSCs. Scale bar, 20 μm. Box plots indicate the median (middle line), the first and third quartiles (box), and the 10th and 90th percentile (error bars). The number of analyzed nuclei is reported in figure (n); unpaired two-tailed Student’s _t_-test was applied for statistical analysis (**** P < 0.0001). d Western Blot analysis of LMNA and pLMNA/C in WT and MLL4Q4092X MSCs; histone H3 was used as loading control. Data are means + SEM of 6 independent experiments for LMNA and 3 independent experiments for pLMNA; unpaired one-tailed Student’s _t_-test was applied for statistical analysis. e Representative maps of stiffness distribution in WT and MLL4Q4092X MSCs acquired with the Brillouin microscope: a higher Brillouin shift corresponds to stiffer portions of the cells. Scale bars, 10 μm. f Bar plot representing nuclear Brillouin shift in WT and MLL4Q4092X MSCs. Data are means + SEM (n = 5 independent experiments); Student’s _t_-test was applied for statistical analysis (**** P < 0.0001). g Representative images and relative quantifications of immunostaining for H4K16ac in WT and MLL4Q4092X MSCs. Scale bar, 20 μm. Box plots indicate the median (middle line), the first and third quartiles (box), and the 10th and 90th percentile (error bars) of the fluorescence intensity. The number of analyzed nuclei is reported in figure (n). Unpaired two-tailed Student’s _t_-test was applied for statistical analysis (**** P < 0.0001). h-i Representative images and relative quantifications of nuclear physical properties (h) and Lamin A/C (i) in WT and MLL4Q4092X MSCs, untreated or treated with TSA (1.5 μM for 24 h). The relative level of chromatin compaction was determined as the ratio of the sum intensity of H3 signal, with respect to the nuclear volume. Scale bar, 20 μm. Box plots indicate the median (middle line), the first and third quartiles (box), and the 10th and 90th percentile (error bars). The number of analyzed nuclei is reported in figure (n). Unpaired two-tailed Student’s _t_-test was applied for statistical analysis (**** P < 0.0001).
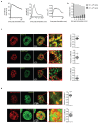
Fig. 6. Role of PcG in determining nuclear architecture
a Western Blot analysis of BMI, RING1B and H3K27me3 in WT, MLL4Q4092X, H3.3WT or H3.3K27M-transduced MLL4Q4092X MSCs; histone H3 was used as loading control. b Representative images of immunostaining for BMI, RING1B and H3K27me3 in WT, MLL4Q4092X, H3.3WT- and H3K27M-transduced MLL4Q4092X MSCs. Merged images are shown; white arrows indicate sites of co-localization. Scale bar, 10 μm. c Representative images and relative quantifications of nuclear shape stained with DNA dye DRAQ5 in WT (n = 127), MLL4Q4092X (n = 114) or MLL4Q4092X MSCs expressing either H3.3WT (n = 101) or H3.3K27M (n = 117). Scale bar, 20 μm. The nuclear area, volume and flattening were determined and are represented as boxplots, indicating the median (middle line), the first and third quartiles (box), and the 10th and 90th percentile (error bars). n = number of analyzed nuclei; unpaired two-tailed Student’s _t_-test was applied for statistical analysis (** P < 0.005; *** P < 0.001; **** P < 0.0001). d Representative images and relative quantifications of immunostaining for LMNA/C in WT (n = 125), MLL4Q4092X (n = 93) or MLL4Q4092X MSCs expressing either H3.3WT (n = 88) or H3.3K27M (n = 113). Scale bar, 20 μm. Box plots indicate the median (middle line), the first and third quartiles (box), and the 10th and 90th percentile (error bars) of the fluorescence intensity. n = number of analyzed nuclei; unpaired two-tailed Student’s _t_-test was applied for statistical analysis. e Representative images of blue light-induced clustering of BMI-mCherry-Cry2 at different time points in NIH 3T3 cells. Cells were stimulated for 1 second with 488-nm light followed by image acquisition; scale bar, 10 μm. f Representative images of stained nuclei of NIH 3T3 cells expressing BMI-mCherry-Cry2 before and after blue light stimulation. For comparison, stained nuclei of non-transfected cells are shown. Clustering of BMI-Cry2 in response to stimulation is shown; scale bar, 5 μm. g Distribution of the normalized (respect to the first time point post stimulation T = 0) area and volume of mock NIH 3T3 cells (n = 49) or NIH 3T3 cells expressing BMI-mCherry-Cry2 (n = 48), before and after blue light stimulation. Data are represented as mean ± SEM. n = analyzed nuclei; unpaired two-tailed Student’s _t_-test was applied for statistical analysis.
Fig. 7. MLL4 contributes to establish nuclear mechanical properties
a Representative images and relative quantifications of immunostaining for YAP/TAZ in WT and MLL4Q4092X MSCs, maintained on sparse condition on stiff substrate. F-actin is stained with Phalloidin. Scale bar, 20 μm. Box plots indicate the median (middle line), the first and third quartiles (box), and the 10th and 90th percentile (error bars). The number of analyzed nuclei is reported in figure (n). Unpaired two-tailed Student’s _t_-test was applied for statistical analysis (**** P < 0.0001). b Luciferase assay to measure the transcriptional activity of YAP/TAZ in WT and MLL4Q4092X MSCs, after transfecting the empty or YAP/TAZ reporter 8XGTIIC‐luc vector. Normalized data are means + SEM (n = 4 independent experiments); unpaired two-tailed Student’s _t_-test was applied for statistical analysis. c Representative images and relative quantifications of immunostaining for YAP/TAZ in WT and MLL4Q4092X MSCs untreated or treated with ATR inhibitor VE-822 (0.2μM), at the indicated time points. Scale bar, 20 μm. Box plots indicate the median (middle line), the first and third quartiles (box), and the 10th and 90th percentile (error bars). The number of analyzed nuclei is reported in figure (n). Unpaired two-tailed Student’s _t_-test was applied for statistical analysis **** P < 0.0001). d Heat map of k-means clustering analysis of expressed genes in WT and MLL4Q4092X MSCs untreated or treated with ATR inhibitor VE-822 (0.2 μM), at the indicated time points. In the lower panel, the expression pattern of ATR-responsive genes is shown. e Heat map showing GO analysis terms of ATR-responsive genes, YAP/TAZ targets and mechano-responsive genes. f qRT-PCR of the indicated genes in WT and MLL4Q4092X MSCs untreated or treated with doxycycline to induce the exogenous expression of YAP1. The expression level was normalized on GAPDH transcript level. Data are means + SEM (n = 4 independent experiments); unpaired two-tailed Student’s _t_-test was applied for statistical analysis (**** P < 0.0001). g qRT-PCR of the indicated genes in WT and MLL4Q4092X MSCs expressing either H3.3WT or H3.3K27M. The expression level was normalized on GAPDH transcript level. Data are means + SEM (n = 4 independent experiments); unpaired two-tailed Student’s _t_-test was applied for statistical analysis.
Fig. 8. MLL4-dependent mechanical properties in cell lineage commitment
a Representative image of WT and MLL4Q4092X MSCs untreated or treated with different concentrations of ATR inhibitor (VE-922), after differentiation towards chondrocytes. Scale bar, 500 μm. Deposition of extracellular matrix and organization into a 3D network was detected by Alcian blue staining and quantified. Data are means + SEM (n = 3 independent experiments); unpaired two-tailed Student’s _t_-test was applied for statistical analysis. b Alcian blue (cartilage) and alizarin Red (bone) staining of Ctrl, _KMT2D 5’UTR_-morpholino and VE822-treated _KMT2D 5’UTR_-morpholino medaka fish. Scale bar, 100μm. c Bar plot of the relative quantification of Parasphenoid (P), Ceratohyal (CH), Paired Prootics (PO), Ceretobranchial 5 (CB5) mineralization in Ctrl, _KMT2D 5’UTR_-morpholino and KMT2D 5’UTR-morpholino-treated with ATR inhibitor. Values were expressed as percentage relative to the control. Data are means ± SEM (n = 10 biologically independent animals); Student’s _t_-test was applied for statistical analysis (**** P < 0.0001). d Distribution of _Col10a1:nuGFP_- and _Osx:mCherry_-expressing premature osteoblasts in Ctrl (upper panels), KMT2D 5’UTR-morpholino (central panels) and VE822-treated KMT2D 5’UTR-morpholino medaka fish (lower panels). Scale bar: 100 μm. e Schematic representation of MSCs alterations in response to MLL4 LoF. The upper panel represents the postulated interplay between transcription-associated and PcG condensates. The 3D chromatin compartmentalization, the intra-nuclear forces and the YAP/TAZ shuttling are shown in the representative cartoon.
Similar articles
- Precocious neuronal differentiation and disrupted oxygen responses in Kabuki syndrome.
Carosso GA, Boukas L, Augustin JJ, Nguyen HN, Winer BL, Cannon GH, Robertson JD, Zhang L, Hansen KD, Goff LA, Bjornsson HT. Carosso GA, et al. JCI Insight. 2019 Oct 17;4(20):e129375. doi: 10.1172/jci.insight.129375. JCI Insight. 2019. PMID: 31465303 Free PMC article. - Precocious chondrocyte differentiation disrupts skeletal growth in Kabuki syndrome mice.
Fahrner JA, Lin WY, Riddle RC, Boukas L, DeLeon VB, Chopra S, Lad SE, Luperchio TR, Hansen KD, Bjornsson HT. Fahrner JA, et al. JCI Insight. 2019 Oct 17;4(20):e129380. doi: 10.1172/jci.insight.129380. JCI Insight. 2019. PMID: 31557133 Free PMC article. - The histone methyltransferase KMT2D, mutated in Kabuki syndrome patients, is required for neural crest cell formation and migration.
Schwenty-Lara J, Nehl D, Borchers A. Schwenty-Lara J, et al. Hum Mol Genet. 2020 Jan 15;29(2):305-319. doi: 10.1093/hmg/ddz284. Hum Mol Genet. 2020. PMID: 31813957 Free PMC article. - Using Xenopus to analyze neurocristopathies like Kabuki syndrome.
Schwenty-Lara J, Pauli S, Borchers A. Schwenty-Lara J, et al. Genesis. 2021 Feb;59(1-2):e23404. doi: 10.1002/dvg.23404. Epub 2020 Dec 22. Genesis. 2021. PMID: 33351273 Review. - Kabuki syndrome: review of the clinical features, diagnosis and epigenetic mechanisms.
Wang YR, Xu NX, Wang J, Wang XM. Wang YR, et al. World J Pediatr. 2019 Dec;15(6):528-535. doi: 10.1007/s12519-019-00309-4. Epub 2019 Oct 5. World J Pediatr. 2019. PMID: 31587141 Review.
Cited by
- The role of Trithorax family regulating osteogenic and Chondrogenic differentiation in mesenchymal stem cells.
Ma Q, Song C, Yin B, Shi Y, Ye L. Ma Q, et al. Cell Prolif. 2022 May;55(5):e13233. doi: 10.1111/cpr.13233. Epub 2022 Apr 28. Cell Prolif. 2022. PMID: 35481717 Free PMC article. Review. - Multidimensional Super-Resolution Microscopy Unveils Nanoscale Surface Aggregates in the Aging of FUS Condensates.
He C, Wu CY, Li W, Xu K. He C, et al. J Am Chem Soc. 2023 Nov 8;145(44):24240-24248. doi: 10.1021/jacs.3c08674. Epub 2023 Oct 2. J Am Chem Soc. 2023. PMID: 37782826 Free PMC article. - Biomolecular condensates at sites of DNA damage: More than just a phase.
Spegg V, Altmeyer M. Spegg V, et al. DNA Repair (Amst). 2021 Oct;106:103179. doi: 10.1016/j.dnarep.2021.103179. Epub 2021 Jul 14. DNA Repair (Amst). 2021. PMID: 34311273 Free PMC article. Review. - Progressive alteration of murine bladder elasticity in actinic cystitis detected by Brillouin microscopy.
Martinez-Vidal L, Testi C, Pontecorvo E, Pederzoli F, Alchera E, Locatelli I, Venegoni C, Spinelli A, Lucianò R, Salonia A, Podestà A, Ruocco G, Alfano M. Martinez-Vidal L, et al. Sci Rep. 2024 Jan 4;14(1):484. doi: 10.1038/s41598-023-51006-2. Sci Rep. 2024. PMID: 38177637 Free PMC article. - UTX condensation underlies its tumour-suppressive activity.
Shi B, Li W, Song Y, Wang Z, Ju R, Ulman A, Hu J, Palomba F, Zhao Y, Le JP, Jarrard W, Dimoff D, Digman MA, Gratton E, Zang C, Jiang H. Shi B, et al. Nature. 2021 Sep;597(7878):726-731. doi: 10.1038/s41586-021-03903-7. Epub 2021 Sep 15. Nature. 2021. PMID: 34526716 Free PMC article.
References
- Spitz F. Gene regulation at a distance: From remote enhancers to 3D regulatory ensembles. Semin Cell Dev Biol. 2016;57:57–67. - PubMed
- Stadhouders R, Filion GJ, Graf T. Transcription factors and 3D genome conformation in cell-fate decisions. Nature. 2019;569:345–354. - PubMed
Publication types
MeSH terms
Substances
Supplementary concepts
LinkOut - more resources
Full Text Sources
Medical
Molecular Biology Databases
Research Materials
Miscellaneous
