Phox2a Defines a Developmental Origin of the Anterolateral System in Mice and Humans - PubMed (original) (raw)
. 2020 Nov 24;33(8):108425.
doi: 10.1016/j.celrep.2020.108425.
Farin B Bourojeni 1, Bishakha Mona 2, Shima Rastegar-Pouyani 1, Raphael Blain 3, Annie Dumouchel 4, Charleen Salesse 4, W Scott Thompson 4, Megan Brookbank 4, Yorick Gitton 3, Lino Tessarollo 5, Martyn Goulding 6, Jane E Johnson 7, Marie Kmita 8, Alain Chédotal 3, Artur Kania 9
Affiliations
- PMID: 33238113
- PMCID: PMC7713706
- DOI: 10.1016/j.celrep.2020.108425
Phox2a Defines a Developmental Origin of the Anterolateral System in Mice and Humans
R Brian Roome et al. Cell Rep. 2020.
Abstract
Anterolateral system neurons relay pain, itch, and temperature information from the spinal cord to pain-related brain regions, but the differentiation of these neurons and their specific contribution to pain perception remain poorly defined. Here, we show that most mouse spinal neurons that embryonically express the autonomic-system-associated Paired-like homeobox 2A (Phox2a) transcription factor innervate nociceptive brain targets, including the parabrachial nucleus and the thalamus. We define the Phox2a anterolateral system neuron birth order, migration, and differentiation and uncover an essential role for Phox2a in the development of relay of nociceptive signals from the spinal cord to the brain. Finally, we also demonstrate that the molecular identity of Phox2a neurons is conserved in the human fetal spinal cord, arguing that the developmental expression of Phox2a is a prominent feature of anterolateral system neurons.
Keywords: LSN; Phox2a; anterolateral tract; autonomic; dI5; dorsal horn; lamina I; lamina V; pain; spinoparabrachial.
Copyright © 2020 The Authors. Published by Elsevier Inc. All rights reserved.
Conflict of interest statement
Declaration of Interests The authors declare no competing interests.
Figures
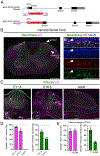
Figure 1.. Spinal Phox2aCre Neurons Reside in Lamina I, Lamina V, and LSN All images are of Phox2a Cre; R26 LSL-tdT/+ mice.
(A) BAC recombination strategy: Cre-PolyA insertion 3′ to the Phox2a ATG codon in the BAC RP23–333J21. (B) tdTomato (tdT)+ neurons in lamina I, lamina V, and LSN of the cervical spinal cord of adult mice. (B’) Magnified box in (B) showing lamina I Neurotrace, tdT, and NeuN co-labeling. (C) Expression of tdT and Phox2a in E11.5, E16.5, and adult mouse spinal cord. (D) Percentage of tdT+ neurons that express Phox2a, as well as percentage of Phox2a+ neurons that express tdT at E11.5 and E16.5 and in adult mice. (E) Percentage of tdT+ neurons that express Phox2a, as well as percentage of Phox2a+ neurons that express tdT in the superficial and deep dorsal horn of E16.5 mouse spinal cords. n = 4 E11.5 mice, n = 4 E16.5 mice, and n = 3 adult Phox2a Cre; R26 LSL-tdT/+ mice. Data are represented as mean ± SEM. Scale bars: 500 μm in (B), 100 μm in (B’), 100 μm in (C), and 25 μm in insets. SG, sympathetic ganglia.
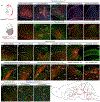
Figure 2.. Spinal Phox2aCre Neurons Innervate AS Targets
(A) Intersectional genetic strategy to visualize spinofugal axons with tdT. Phox2a Cre; R26 LSL-tdT/+ mice have tdT cellular expression in the brain and spinal cord, while Phox2a Cre; Cdx2 FlpO; R26 FSF-LSL-tdT/+ mice have cellular tdT expression only in spinal Phox2a neurons. (B–F’) In (B)–(F): expression of cellular tdT in the brain and spinal cord of Phox2a Cre; R26 LSL-tdT/+ mice in comparison to (B’–F’) the lack of tdT expression in the brain and spinal cord of Phox2a Cre; Cdx2 FlpO; R26 FSF-LSL-tdT/+ mice, except caudal to the cervical level. In (E’), arrow indicates presumptive anterolateral tract (ALT) axons in white matter. Insets in (E), (F), (E’), and (F’) correspond to stippled boxes and show tdT+ cell bodies (white arrows) (G–P) Prominent targets of tdT+ spinofugal axons. Higher magnifications are shown in (M’) and (N’). (Q–Q”) vGluT2 and tdT immunohistochemistry in the thalamus demonstrates putative excitatory synaptic termini arising from spinofugal axons. The image in (Q) is duplicated from (H) and is used as a reference for (Q’) and (Q”). (R) Diagram summarizing the termination sites of tdT+ spinofugal axons. n = 3 Phox2a Cre; R26 LSL-tdT/+ adult mice, and n = 3 Phox2a Cre; Cdx2 FlpO; R26 FSF-LSL-tdT/+ adult mice. Scale bars: 100 μm, except 25 μm for (Q’) and (Q”). AP, area postrema; CU, cuneate nucleus; DR, dorsal raphe; DRt, dorsal reticular nucleus; GRN, gigantocellular reticular nucleus; ic, internal capsule; IRN, intermediate reticular nucleus; LH, lateral habenula; LP, lateral posterior thalamus; LRN, lateral reticular nucleus; MEV, midbrain trigeminal nucleus; MH, medial habenula; mo, molecular layer of the cerebellum; MV, medial vestibular nucleus; mVII, facial motor nucleus; mX, vagal motor nucleus; mXII, hypoglossal motor nucleus; NLL, nucleus of the lateral lemniscus; nVII, facial motor nerve; PAS, parasolitary nucleus; pBdm, dorsal-medial parabrachial nucleus; PCG, pontine central gray; PRN, pontine reticular nucleus; PRP, nucleus prepositus; PVT, paraventricular thalamus; RT, reticular thalamic nucleus; SCi, superior colliculus, intermediate laminae; scp, superior cerebellar peduncle; SCs, superior colliculus, superficial laminae; SPV, spinal trigeminal nucleus; ZI, zona incerta.
Figure 3.. Spinal Phox2aCre Neurons Are Predominantly AS Neurons
(A and B) Adult Phox2a Cre; R26 LSL-tdT/+ mice were injected with FG in the VPL thalamus (A) and CTb-488 in the parabrachial nucleus (B). (C and D) Percentage of cervical spinal cord dorsal horn projection neurons expressing tdT, classified as those labeled with either tracer (C; All PNs) or selectively with FG or CTb (D). (E) Diagram of the locations of tdT+ only, retrograde-labeled only (FG or CTb), or tdT+ and tracer-labeled (violet) neurons, in 5 non-sequential 25-μm sections of the cervical spinal cord of one representative animal. (F–G’) In (F) and (G): representative images of the cervical spinal cord demonstrating tdT+ neuron labeling by retrograde tracers. See Figures S3A and S3B for more examples. (F’ and G’) High magnification of boxed areas in (F) and (G), depicting retrograde-labeled lamina I (F’) or lamina V/LSN (G’) tdT+ neurons (indicated by yellow arrows). (H–N) Laminar analysis of neuron location in the cervical spinal cord ipsilateral or contralateral to tracer injection. (H–K) Percentage of tracer-labeled neurons in lamina I (H and I) or lamina V/LSN (J and K) also expressing tdT, separated by tracer type. (L–N) Percentage of tdT-labeled neurons labeled with one or both tracers in all laminae (L), in lamina V/LSN (M), or in lamina I (N). (O) Diagram depicting overlap between tdT and retrograde tracer in lamina I of a representative mouse. (P) Diagrams illustrating the estimated percentages of cervical and lumbar lamina I Phox2aCre neurons projecting to mouse pB, VPL, or both. Stippled line represents spinal midline. n = 7 Phox2a Cre; R26 LSL-tdT/+ adult mice (4 male, 3 female). Mann-Whitney test in (I) and (K); **p < 0.01; ns, non-significant. Data are represented as mean ± SEM. Scale bars: 250 μm in (A) and (B), 100 μm in (F) and (G), and 50 μm in (F’) and (G’).
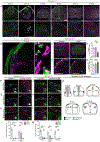
Figure 4.. Heterogeneity of Spinal Phox2a Neuron Migration, Sensory Afferent Interaction, and Birth Time
(A) Migration of Phox2a+ and tdT+ neurons in embryonic spinal cords of Phox2a Cre; R26 LSL-tdT/+ mice between E10.5 and E15.5. Boxed regions in upper panels are magnified below. (B–B”) Location of tdT+ neurons in the dorsal horn of Phox2a Cre; R26 LSL-tdT/+ spinal cords at E13.0, highlighting contacts (B’ and B”) between lamina I neurons and TrkA+ sensory afferents (white arrowheads). (C–E) Spinal Phox2a neuron (white arrows) location in E14.5 TrkA+/+, TrkA+/‒, and _TrkA_−/− mouse embryos. Boxed regions in (C) are magnified in (C’). (D and E) Counts of Phox2a neurons in lamina I (D) and lamina V/LSN (E). (F–M) Birthdating of spinal Phox2a (F–I) or tdT (J–M) neurons in E16.5 Phox2a Cre; R26 LSL-tdT/+ mouse embryos, exposed to BrdU at E9.5 (F and J), E10.5 (G and K) or E11.5 (H and L). (I and M) Phox2a+/BrdU+ (I) or tdT+/BrdU+ (M) neurons as a percentage of all Phox2a+ or tdT+ neurons in either lamina I, lamina V/LSN, or laminae II/III (“Antenna”-like neurons) and compared between groups. (N) Diagram of migration of spinal Phox2a neuron subpopulations. Phox2a Cre; R26 LSL-tdT/+ embryos: (A) n = 3 E10.5, n = 3 E11.5, n = 3 E12.5, n = 3 E13.5, n = 3 E14.5, and n = 3 E15.5; (B–B”) n = 3 E13.0 embryos; (F–M) n = 4–5 E16.5 embryos per condition. (C–E) n = 3 TrkA+/+, n = 5 TrkA+/−, and n = 3 _TrkA_−/− E14.5 embryos. In (D) and (E), one-way ANOVA, with Tukey’s multiple comparisons test; in (I) and (M), individual one-way ANOVAs for each neuron type with Tukey’s multiple comparisons test. **p < 0.01; ***p < 0.001. Data are represented as mean ± SEM. Scale bars: 100 μm in (A) and (C); 50 μm in (B), (C’), (F)–(H), and (J)–(L); 10 μm in (B’) and insets in (F)–(H) and (J)–(L); and 1 μm in (B”). NF-L: Neurofilament-L.
Figure 5.. The Molecular Identity and Specification of Spinal Phox2a Neurons
(A) Co-expression of Phox2a with embryonic spinal neuron markers in the E10.5 Phox2a Cre; R26 LSL-tdT/+ spinal cord using immunohistochemistry. (B) Quantification of each marker as a percentage of Phox2a+/Lmx1b+ neurons. (C–F) Phox2a expression in control (C), Ascl1 null (D), and Ptf1a null (E) E11.5 spinal cords, with the average number of Phox2a+ cells per section quantified in (F). (C’), (D’), and (E’) show high magnification of boxed regions in (C), (D), and (E), respectively. (G–J) Representative images from transverse sections of E4 chick neural tubes co-electroporated with the ePhox2a-GFP reporter and expression plasmids: control (Myc-tag only) (G), Myc Ascl1 (H), Myc Ascl1 and Prdm13 (I), or Myc Ptf1a (J). Insets show control Myc-tag, Prdm13, or Ptf1a expression. (K) Diagram of Phox2a expression regulation showing direct transcriptional upregulation by Ascl1, upregulation by Lmx1b (Figure S5), and repression by Ptf1a. (L–P) Single-cell RNA-seq data analysis of dI5 (Lmx1b+) neurons (Delile et al., 2019). (L and M) UMAP analysis (L) of _Lmx1b_+ neurons from E9.5–E13.5 compared between each other, with volcano plot of cluster-6-enriched mRNAs (M) compared to all other neurons. (N–P) UMAP analysis (N) of _Lmx1b_+ neurons from E9.5–E11.5 compared between each other, with volcano plots of cluster-2-enriched mRNAs (O) and cluster-3-enriched mRNAs (P) compared to all other neurons. (Q–V) In situ hybridization of select mRNAs enriched in dI5 (Q; E11.5) and lamina I neurons (T; E16.5) based on UMAP analyses. The percentage of _Phox2a_+ neurons co-expressing selected mRNAs are quantified at both embryonic time points in (R) and (U). Tac1 is present in dI5 _Lmx1b_+ neurons and lamina I neurons that do not express Phox2a, as depicted in diagrams in (S) and (V). Phox2a Cre; R26 LSL-tdT/+ embryos: (A and B) n = 3 E10.5; (Q and R) n = 3 E11.5; (T and U) n = 3–4 E16.5 embryos. (C–F) n = 6 control, n = 3 Ascl1GFP/GFP, and n = 4 Ptf1aCre/Cre embryos. (G–J) n = 6 E4 chicken embryos for each condition. Student’s t test in (F); **p < 0.01; ***p < 0.001. Data are represented as mean ± SEM. Data in (L)–(P) are derived from Delile et al. (2019); data processing and statistics are described in STAR Methods. Scale bars: 50 μm for all, except 10 μm for insets in (A). DRG, dorsal root ganglion; FC, fold change; MN, motor neuron.
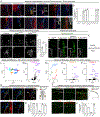
Figure 6.. Phox2a Is Required for the Normal Development and Function of a Subset of AS Neurons
(A) The parabrachial nucleus (pB) of control (Hoxb8 Cre; Phox2a+/+; R26 LSL-tdT/+; Ctrl, top row) and Phox2acKO (Hoxb8 Cre; Phox2a f/f; R26 LSL-tdT/+; cKO, bottom row) adult mice, depicting spinoparabrachial axons labeled via Hoxb8 _Cre_-driven axonal tdT expression. Right panels show magnified views of the left panels, with insets depicting tdT axons (red arrows). (B) Diagram depicting the loss of spinal afferents (magenta) to the pB of Phox2acKO mice. (C–E) Spinal neurons labeled by CTb injections in the pB, in lamina I (left column of C, quantified in D) and lamina V/LSN (right column of C, quantified in E), in control (top row) and Phox2acKO (bottom row) adult mice. (F and G) Co-expression of Phox2a and Lmx1b with dI5-enriched mRNAs in control (top row) and Phox2acKO (bottom row) E11.5 spinal cords (F), quantified as a percentage of _Phox2a_+ neurons (G). See Figure S6 for additional images. (H and I) Distribution of _Phox2a_+ neurons in E16.5 control and Phox2acKO mouse embryos. (H) Insets show individual _Phox2a_+ cells magnified. (I) Individual Phox2a neuron locations (left) and density plots of _Phox2a_+ neurons (right) derived from 3–5 sections (10 μm) of 4 control (gray) and 4 Phox2acKO (black) E16.5 spinal cords. Coordinates and mediolateral distribution are normalized to the width and height of an idealized spinal cord. Individual lines on density plots represent single animals, dotted lines represent mean distribution of 4 animals, gray lines represent control embryos, and black lines represent Phox2acKO _Phox2a_+ cells. Black arrows point to the bimodal distribution of Phox2acKO _Phox2a_+ cells in deep laminae. Average mediolateral positions of lamina I and lamina V/LSN neurons are statistically compared. (J and K) Co-expression of Phox2a with dI5-enriched mRNAs in lamina I of control (top row) and Phox2acKO (bottom row) E16.5 spinal cords (J), quantified as a percentage of _Phox2a_+ neurons (K). (L and M) Co-expression of Phox2a and candidate lamina V/LSN neuron marker mRNAs in lamina V/LSN neurons of control (top row) and Phox2acKO (bottom row) E16.5 spinal cords (L), quantified as a percentage of _Phox2a_+ neurons (M). See Figure S6 for additional images. (N–X) Behavioral tests in control and Phox2acKO mice. (N) Radiant heat paw-withdrawal assay; n = 11 control, and n = 12 Phox2acKO. (O) Hot-water tail flick assay; n = 11 control, and n = 12 Phox2acKO. (P) von Frey test; n = 10 control, and n = 10 Phox2acKO. (Q) Adhesive removal latency; n = 11 control, and n = 10 Phox2acKO. (R and S) Time spent licking (R) and latency to any response (S) during the hot-plate test; n = 13 control, and n = 14 Phox2acKO. (T) Acetone test; n = 11 control, and n = 11 Phox2acKO. (U) Foot clip test; n = 15 control, and n = 16 Phox2acKO. (V) Capsaicin test; n = 11 control, and n = 12 Phox2acKO. (W and X) Formalin test (acute phase in W; late phase in X); n = 11 control, and n = 12 Phox2acKO. In (A), n = 4 control, and n = 4 Phox2acKO adult mice. (C–E) n = 4 control, and n = 6 Phox2acKO adult mice. (F and G) n = 3 control, and n = 5 Phox2acKO E11.5 mice. (H and I) n = 4 control, and n = 4 Phox2acKO E16.5 mice. (J and K) n = 3–4 control, and n = 3 Phox2acKO E16.5 mice. (L and M) n = 3–8 control, and n = 3–8 Phox2acKO E16.5 mice. (N–X) The ns are given above. In (D) and (E), two-way ANOVA with Tukey’s multiple comparisons test; in (I), unpaired t test; in (G), (K), and (M), multiple t tests using the Holm-Sidak method; in (Q), mixed-effects analysis with Sidak’s multiple comparisons test; and Mann-Whitney test in (N)–(P) and (R)–(X). ns, non-significant; *p < 0.05; **p < 0.01; ***p < 0.001. Data are represented as mean ± SEM. Scale bars: 250 μm in (A); 50 μm in (C); (H) 100 μm in (H); 20 μm in insets for (H); 50 μm in (F), (J), and (L); and 10 μm in insets for (F), (J), and (L). Images in Figure 5Q have been re-used in Figure 6F, and images in Figure 5T have been re-used in Figure 6J. Data from Figures 5R and 5U representing the above images are re-used in Figures 6G and 6K, respectively. These data were collected and analyzed as a single experiment.
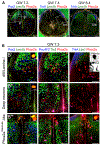
Figure 7.. Phox2a Neuron Molecular Identity Is Conserved in the Developing Human Spinal Cord
(A) Sections of GW7.3–GW8.4 human spinal cords showing Phox2a, Lmx1b, TrkA, and Pax2 expression. Location of higher magnification panels is shown in boxed regions. (B–B”’) In (B): Phox2a, Lmx1b, Pax2, Pou4F2, Tlx3, Lbx1, and TrkA expression in the GW7.3 spinal cord, demonstrating co-labeling of Phox2a neurons with dorsal horn markers Lmx1b and Lbx1, but not with Pax2, Pou4F2, or Tlx3, in a Phox2aLamI/Phox2aDeepEarly-like cluster (B’), the deep dorsal horn (B”), and a Phox2aDeepLate-like cluster near the roof plate (B”’). Top right panel shows apposition of Phox2a cells with TrkA+ sensory afferents, similar to that in mouse (Figure 4). Insets show higher magnification of boxed regions (TrkA and Phox2a channels split and inverted). In (A), three human embryonic spinal cords (GW7.3, GW7.4, and GW8.4) are represented. In (B), one GW7.3 human embryonic spinal cord from (A) is represented. Scale bars: 200 μm in (A), 100 μm in (B), and 10 μm in insets in (B’)–(B”’)
Similar articles
- Genetic evidence of the function of Phox2a-expressing anterolateral system neurons in the transmission of chronic pain.
Zhang X, Millecamps M, Kania A. Zhang X, et al. Mol Pain. 2023 Jan-Dec;19:17448069231170546. doi: 10.1177/17448069231170546. Mol Pain. 2023. PMID: 37015885 Free PMC article. - Characterisation of lamina I anterolateral system neurons that express Cre in a Phox2a-Cre mouse line.
Alsulaiman WAA, Quillet R, Bell AM, Dickie AC, Polgár E, Boyle KA, Watanabe M, Roome RB, Kania A, Todd AJ, Gutierrez-Mecinas M. Alsulaiman WAA, et al. Sci Rep. 2021 Sep 9;11(1):17912. doi: 10.1038/s41598-021-97105-w. Sci Rep. 2021. PMID: 34504158 Free PMC article. - Netrin1 and reelin signaling are required for the migration of anterolateral system neurons in the embryonic spinal cord.
Roome RB, Rastegar-Pouyani S, Ker A, Dumouchel A, Kmita M, Kania A. Roome RB, et al. Pain. 2022 Apr 1;163(4):e527-e539. doi: 10.1097/j.pain.0000000000002444. Pain. 2022. PMID: 34471084 - The Spino-Parabrachial Pathway for Itch.
Piyush Shah D, Barik A. Piyush Shah D, et al. Front Neural Circuits. 2022 Feb 17;16:805831. doi: 10.3389/fncir.2022.805831. eCollection 2022. Front Neural Circuits. 2022. PMID: 35250493 Free PMC article. Review. - Mechanisms of esophageal pain.
Lynn RB. Lynn RB. Am J Med. 1992 May 27;92(5A):11S-19S. doi: 10.1016/0002-9343(92)80051-z. Am J Med. 1992. PMID: 1595755 Review.
Cited by
- Conserved genetic signatures parcellate cardinal spinal neuron classes into local and projection subsets.
Osseward PJ 2nd, Amin ND, Moore JD, Temple BA, Barriga BK, Bachmann LC, Beltran F Jr, Gullo M, Clark RC, Driscoll SP, Pfaff SL, Hayashi M. Osseward PJ 2nd, et al. Science. 2021 Apr 23;372(6540):385-393. doi: 10.1126/science.abe0690. Science. 2021. PMID: 33888637 Free PMC article. - Shank2 identifies a subset of glycinergic neurons involved in altered nociception in an autism model.
Olde Heuvel F, Ouali Alami N, Aousji O, Pogatzki-Zahn E, Zahn PK, Wilhelm H, Deshpande D, Khatamsaz E, Catanese A, Woelfle S, Schön M, Jain S, Grabrucker S, Ludolph AC, Verpelli C, Michaelis J, Boeckers TM, Roselli F. Olde Heuvel F, et al. Mol Autism. 2023 Jun 14;14(1):21. doi: 10.1186/s13229-023-00552-7. Mol Autism. 2023. PMID: 37316943 Free PMC article. - Brain circuits for pain and its treatment.
Mercer Lindsay N, Chen C, Gilam G, Mackey S, Scherrer G. Mercer Lindsay N, et al. Sci Transl Med. 2021 Nov 10;13(619):eabj7360. doi: 10.1126/scitranslmed.abj7360. Epub 2021 Nov 10. Sci Transl Med. 2021. PMID: 34757810 Free PMC article. Review. - The organization of spinal neurons: Insights from single cell sequencing.
Roome RB, Levine AJ. Roome RB, et al. Curr Opin Neurobiol. 2023 Oct;82:102762. doi: 10.1016/j.conb.2023.102762. Epub 2023 Aug 30. Curr Opin Neurobiol. 2023. PMID: 37657185 Free PMC article. Review. - Human assembloid model of the ascending neural sensory pathway.
Kim JI, Imaizumi K, Jurjuț O, Kelley KW, Wang D, Thete MV, Hudacova Z, Amin ND, Levy RJ, Scherrer G, Pașca SP. Kim JI, et al. Nature. 2025 Jun;642(8066):143-153. doi: 10.1038/s41586-025-08808-3. Epub 2025 Apr 9. Nature. 2025. PMID: 40205039 Free PMC article.
References
- Allen Institute for Brain Science (2004). Allen Mouse Brain Atlas https://mouse.brain-map.org/static/atlas.
- Allen Institute for Brain Science (2008). Allen Spinal Cord Atlas http://mousespinal.brain-map.org/.
- Altman J, and Bayer SA (2001). Development of the Human Spinal Cord: An Interpretation Based on Experimental Studies in Animals (Oxford University Press; ).
- Andrew D, and Craig AD (2001). Spinothalamic lamina I neurons selectively sensitive to histamine: a central neural pathway for itch. Nat. Neurosci 4, 72–77. - PubMed
- Apkarian AV, Stevens RT, and Hodge CJ (1985). Funicular location of ascending axons of lamina I cells in the cat spinal cord. Brain Res 334, 160–164. - PubMed
Publication types
MeSH terms
Substances
LinkOut - more resources
Full Text Sources
Molecular Biology Databases
Research Materials
