Statistical Complexity Analysis of Turing Machine tapes with Fixed Algorithmic Complexity Using the Best-Order Markov Model - PubMed (original) (raw)
Statistical Complexity Analysis of Turing Machine tapes with Fixed Algorithmic Complexity Using the Best-Order Markov Model
Jorge M Silva et al. Entropy (Basel). 2020.
Abstract
Sources that generate symbolic sequences with algorithmic nature may differ in statistical complexity because they create structures that follow algorithmic schemes, rather than generating symbols from a probabilistic function assuming independence. In the case of Turing machines, this means that machines with the same algorithmic complexity can create tapes with different statistical complexity. In this paper, we use a compression-based approach to measure global and local statistical complexity of specific Turing machine tapes with the same number of states and alphabet. Both measures are estimated using the best-order Markov model. For the global measure, we use the Normalized Compression (NC), while, for the local measures, we define and use normal and dynamic complexity profiles to quantify and localize lower and higher regions of statistical complexity. We assessed the validity of our methodology on synthetic and real genomic data showing that it is tolerant to increasing rates of editions and block permutations. Regarding the analysis of the tapes, we localize patterns of higher statistical complexity in two regions, for a different number of machine states. We show that these patterns are generated by a decrease of the tape's amplitude, given the setting of small rule cycles. Additionally, we performed a comparison with a measure that uses both algorithmic and statistical approaches (BDM) for analysis of the tapes. Naturally, BDM is efficient given the algorithmic nature of the tapes. However, for a higher number of states, BDM is progressively approximated by our methodology. Finally, we provide a simple algorithm to increase the statistical complexity of a Turing machine tape while retaining the same algorithmic complexity. We supply a publicly available implementation of the algorithm in C++ language under the GPLv3 license. All results can be reproduced in full with scripts provided at the repository.
Keywords: Markov models; algorithmic complexity; compression-based analysis; computational complexity; information theory; statistical complexity; turing machines.
Conflict of interest statement
The authors declare no conflict of interest.
Figures
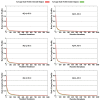
Figure A1
Average rule complexity profiles obtained from pseudo-randomly selected TMs with #Q∈{2,…,6} and #Σ={2,3} up to 1000 iterations.
Figure A2
Comparison between the NC and BDM for 10,000 TM that have run over 50,000 iterations. (top-left) TMs with #Q=6,#Σ=2; (top-right) TMs with #Q=8,#Σ=2; (bottom-left) TMs with #Q=10,#Σ=2; and (bottom-right) an example with non-scaled BDM results.
Figure 1
Heat map of Normalized Compression with an increase in permutation and edition rate. Generated string starting with 500 zeros followed by 500 ones (top); NC_007044.1 Microplitis demolitor bracovirus segment O, complete genome (bottom-left); and MH201455.1 Human parvovirus B19 isolate BX1, complete genome (bottom-right).
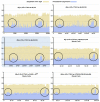
Figure 2
Plot of all TMs in Table 2. NC value is in blue and the tape’s normalized amplitude size is in yellow. The x-axes of the plots represent the index of the Turing machine computed according to Algorithm A1. The blue background is the plot that corresponds to the group of TMs with #Σ=3 and #Q=2; all other plots have #Σ=2.
Figure 3
The average value for the amplitude of TM’s tape (top-left); average required bits to perform compression of the tape (top-middle); and average NC value (top-right), inside and outside the regions marked with circles in Figure 2. The average bits required (bottom-left); and the average NC value obtained for the rules used by the TM (bottom-right), inside and outside the regions marked with circles in Figure 2
Figure 4
Regional capture of average rule complexity profiles obtained from pseudo-randomly selected TMs with #Q∈{2,3,5,6} and #Σ=2 up to 1000 iterations.
Figure 5
Normal complexity profiles (left); and dynamic complexity profiles (right) obtained for some of the filtered TMs. Each TM has a different cardinality of states or alphabet.
Figure 6
Comparison between the NC and BDM for 10,000 TM with #Q=10 and #Σ=2 that ran over 50,000 iterations: (Left) BDM scaled by a factor of 102; and (Right) same example but with non-scaled BDM.
Figure 7
Comparison of: Method I (left); and Method II (right). (Top) Plots show the amplitude of the tapes, bits required to represent the sequence, and the NC obtained for 200 TMs after a low-pass filter was applied. (Bottom) Plots show the average tape amplitude (bottom-left); average bits required (bottom-middle); and NC (bottom-right). Green and red colors represent TMs before and after the method was applied, respectively. For Method I, the average corresponds to 200 instances and for Method II to 2000.
Figure 8
First 59 characters of TMs’ tapes before and after the Method II was applied.
Figure 9
Average final amplitude of the tape (top-left); variation of the bits required to represent the string (top-right); and variation of the NC (bottom), with the increase in number of rule iterations and tape iterations.
Similar articles
- A Decomposition Method for Global Evaluation of Shannon Entropy and Local Estimations of Algorithmic Complexity.
Zenil H, Hernández-Orozco S, Kiani NA, Soler-Toscano F, Rueda-Toicen A, Tegnér J. Zenil H, et al. Entropy (Basel). 2018 Aug 15;20(8):605. doi: 10.3390/e20080605. Entropy (Basel). 2018. PMID: 33265694 Free PMC article. - Calculating Kolmogorov complexity from the output frequency distributions of small Turing machines.
Soler-Toscano F, Zenil H, Delahaye JP, Gauvrit N. Soler-Toscano F, et al. PLoS One. 2014 May 8;9(5):e96223. doi: 10.1371/journal.pone.0096223. eCollection 2014. PLoS One. 2014. PMID: 24809449 Free PMC article. - Symmetry and Correspondence of Algorithmic Complexity over Geometric, Spatial and Topological Representations.
Zenil H, Kiani NA, Tegnér J. Zenil H, et al. Entropy (Basel). 2018 Jul 18;20(7):534. doi: 10.3390/e20070534. Entropy (Basel). 2018. PMID: 33265623 Free PMC article. - A Review of Graph and Network Complexity from an Algorithmic Information Perspective.
Zenil H, Kiani NA, Tegnér J. Zenil H, et al. Entropy (Basel). 2018 Jul 25;20(8):551. doi: 10.3390/e20080551. Entropy (Basel). 2018. PMID: 33265640 Free PMC article. Review. - Toward a formal theory for computing machines made out of whatever physics offers.
Jaeger H, Noheda B, van der Wiel WG. Jaeger H, et al. Nat Commun. 2023 Aug 16;14(1):4911. doi: 10.1038/s41467-023-40533-1. Nat Commun. 2023. PMID: 37587135 Free PMC article. Review.
Cited by
- A Review of Methods for Estimating Algorithmic Complexity: Options, Challenges, and New Directions.
Zenil H. Zenil H. Entropy (Basel). 2020 May 30;22(6):612. doi: 10.3390/e22060612. Entropy (Basel). 2020. PMID: 33286384 Free PMC article. Review. - AC2: An Efficient Protein Sequence Compression Tool Using Artificial Neural Networks and Cache-Hash Models.
Silva M, Pratas D, Pinho AJ. Silva M, et al. Entropy (Basel). 2021 Apr 26;23(5):530. doi: 10.3390/e23050530. Entropy (Basel). 2021. PMID: 33925812 Free PMC article.
References
- Sacks D. Letter Perfect: The Marvelous History of Our Alphabet from A to Z. Broadway Books; Portland, OR, USA: 2004. p. 395.
- Drucker J. The Alphabetic Labyrinth: The Letters in History and Imagination. Thames and Hudson; London, UK: 1995. p. 320.
- Copeland B.J. The Modern History of Computing. [(accessed on 13 January 2020)]; Available online: https://plato.stanford.edu/entries/computing-history/
- Newman M.H.A. General principles of the design of all-purpose computing machines. Proc. R. Soc. Lond. 1948;195:271–274.
- Turing A.M. On Computable Numbers, with an Application to the Entscheidungsproblem. Proc. R. Soc. Lond. 1936;s2-42:230–265. doi: 10.1112/plms/s2-42.1.230. - DOI
LinkOut - more resources
Full Text Sources


