Anthropogenic modification of forests means only 40% of remaining forests have high ecosystem integrity - PubMed (original) (raw)
doi: 10.1038/s41467-020-19493-3.
A Duncan 2, T D Evans 2, K R Jones 2, H L Beyer 3, R Schuster 4, J Walston 2, J C Ray 5, J G Robinson 2, M Callow 2, T Clements 2, H M Costa 2, A DeGemmis 2, P R Elsen 2, J Ervin 6, P Franco 2, E Goldman 7, S Goetz 8, A Hansen 9, E Hofsvang 10, P Jantz 8, S Jupiter 2, A Kang 2, P Langhammer 11 12, W F Laurance 13, S Lieberman 2, M Linkie 2, Y Malhi 14, S Maxwell 3, M Mendez 2, R Mittermeier 11, N J Murray 13 15, H Possingham 16 17, J Radachowsky 2, S Saatchi 18, C Samper 2, J Silverman 2, A Shapiro 19, B Strassburg 20, T Stevens 2, E Stokes 2, R Taylor 7, T Tear 2, R Tizard 2, O Venter 21, P Visconti 22, S Wang 2, J E M Watson 2 3
Affiliations
- PMID: 33293507
- PMCID: PMC7723057
- DOI: 10.1038/s41467-020-19493-3
Anthropogenic modification of forests means only 40% of remaining forests have high ecosystem integrity
H S Grantham et al. Nat Commun. 2020.
Erratum in
- Author Correction: Anthropogenic modification of forests means only 40% of remaining forests have high ecosystem integrity.
Grantham HS, Duncan A, Evans TD, Jones KR, Beyer HL, Schuster R, Walston J, Ray JC, Robinson JG, Callow M, Clements T, Costa HM, DeGemmis A, Elsen PR, Ervin J, Franco P, Goldman E, Goetz S, Hansen A, Hofsvang E, Jantz P, Jupiter S, Kang A, Langhammer P, Laurance WF, Lieberman S, Linkie M, Malhi Y, Maxwell S, Mendez M, Mittermeier R, Murray NJ, Possingham H, Radachowsky J, Saatchi S, Samper C, Silverman J, Shapiro A, Strassburg B, Stevens T, Stokes E, Taylor R, Tear T, Tizard R, Venter O, Visconti P, Wang S, Watson JEM. Grantham HS, et al. Nat Commun. 2021 Jan 20;12(1):592. doi: 10.1038/s41467-021-20999-7. Nat Commun. 2021. PMID: 33473136 Free PMC article. No abstract available.
Abstract
Many global environmental agendas, including halting biodiversity loss, reversing land degradation, and limiting climate change, depend upon retaining forests with high ecological integrity, yet the scale and degree of forest modification remain poorly quantified and mapped. By integrating data on observed and inferred human pressures and an index of lost connectivity, we generate a globally consistent, continuous index of forest condition as determined by the degree of anthropogenic modification. Globally, only 17.4 million km2 of forest (40.5%) has high landscape-level integrity (mostly found in Canada, Russia, the Amazon, Central Africa, and New Guinea) and only 27% of this area is found in nationally designated protected areas. Of the forest inside protected areas, only 56% has high landscape-level integrity. Ambitious policies that prioritize the retention of forest integrity, especially in the most intact areas, are now urgently needed alongside current efforts aimed at halting deforestation and restoring the integrity of forests globally.
Conflict of interest statement
The authors declare no competing interests.
Figures
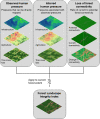
Fig. 1. Methods used to construct the Forest Landscape Integrity Index.
The Forest Landscape Integrity Index was constructed based on three main data inputs: (1) observed pressures (infrastructure, agriculture, tree cover loss), (2) inferred pressure modeled based on proximity to the observed pressures, and (3) change in forest connectivity.
Fig. 2. Forest Landscape Integrity Index map.
A global map of Forest Landscape Integrity for the start of 2019. Three regions are highlighted including (a) Smoky Mountains National Park in Tennessee USA, (b) a region in Shan State Myanmar, and (c) Reserva Natural del Estuario del Muni in Equatorial Guinea. Maps A1–C1 shows the Forest Landscape Integrity Index for these locations. A2, B2, and C2 are photographs from within these regions: (A2) the edge of Smoky Mountains National Park; (B2) shows a logging truck passing through some partially degraded forest along a newly constructed highway in Shan Stat; and, (C3) shows an intact mangrove forest within Reserva Natural del Estuario del Muni, near the border with Gabon. The stars in (a), (b), and (c) indicate approximate location of where these photos were taken. All photos were taken by H.S.G.
Fig. 3. Forest Landscape Integrity Index map categorized into three illustrative classes.
The Forest Landscape Integrity Index for 2019 categorized into three broad, illustrative classes and mapped across each biogeographic realm (a–g). The size of the pie charts indicates the relative size of the forests within each realm (a–g), and h shows all the world’s forest combined.
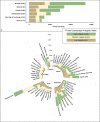
Fig. 4. Forest Landscape Integrity Index map categorized into three illustrative classes for each major forested country.
The Forest Landscape Integrity Index for 2019 categorized into three broad, illustrative classes for each major forested country in the world. (a) countries with a forest extent larger than 1 million km2, and (b) countries with forest extent between 1 million km2 and 100,000 km2 of forest. The size of the bar represents the area of a country’s forests.
Similar articles
- The exceptional value of intact forest ecosystems.
Watson JEM, Evans T, Venter O, Williams B, Tulloch A, Stewart C, Thompson I, Ray JC, Murray K, Salazar A, McAlpine C, Potapov P, Walston J, Robinson JG, Painter M, Wilkie D, Filardi C, Laurance WF, Houghton RA, Maxwell S, Grantham H, Samper C, Wang S, Laestadius L, Runting RK, Silva-Chávez GA, Ervin J, Lindenmayer D. Watson JEM, et al. Nat Ecol Evol. 2018 Apr;2(4):599-610. doi: 10.1038/s41559-018-0490-x. Epub 2018 Feb 26. Nat Ecol Evol. 2018. PMID: 29483681 Review. - Anthropogenic disturbance in tropical forests can double biodiversity loss from deforestation.
Barlow J, Lennox GD, Ferreira J, Berenguer E, Lees AC, Mac Nally R, Thomson JR, Ferraz SF, Louzada J, Oliveira VH, Parry L, Solar RR, Vieira IC, Aragão LE, Begotti RA, Braga RF, Cardoso TM, de Oliveira RC Jr, Souza CM Jr, Moura NG, Nunes SS, Siqueira JV, Pardini R, Silveira JM, Vaz-de-Mello FZ, Veiga RC, Venturieri A, Gardner TA. Barlow J, et al. Nature. 2016 Jul 7;535(7610):144-7. doi: 10.1038/nature18326. Epub 2016 Jun 29. Nature. 2016. PMID: 27362236 - Indigenous lands in protected areas have high forest integrity across the tropics.
Sze JS, Childs DZ, Carrasco LR, Edwards DP. Sze JS, et al. Curr Biol. 2022 Nov 21;32(22):4949-4956.e3. doi: 10.1016/j.cub.2022.09.040. Epub 2022 Oct 26. Curr Biol. 2022. PMID: 36302386 - Humid tropical vertebrates are at lower risk of extinction and population decline in forests with higher structural integrity.
Pillay R, Watson JEM, Hansen AJ, Jantz PA, Aragon-Osejo J, Armenteras D, Atkinson SC, Burns P, Ervin J, Goetz SJ, González-Del-Pliego P, Robinson NP, Supples C, Virnig ALS, Williams BA, Venter O. Pillay R, et al. Nat Ecol Evol. 2022 Dec;6(12):1840-1849. doi: 10.1038/s41559-022-01915-8. Epub 2022 Nov 3. Nat Ecol Evol. 2022. PMID: 36329351 - Toward an integrated monitoring framework to assess the effects of tropical forest degradation and recovery on carbon stocks and biodiversity.
Bustamante MM, Roitman I, Aide TM, Alencar A, Anderson LO, Aragão L, Asner GP, Barlow J, Berenguer E, Chambers J, Costa MH, Fanin T, Ferreira LG, Ferreira J, Keller M, Magnusson WE, Morales-Barquero L, Morton D, Ometto JP, Palace M, Peres CA, Silvério D, Trumbore S, Vieira IC. Bustamante MM, et al. Glob Chang Biol. 2016 Jan;22(1):92-109. doi: 10.1111/gcb.13087. Epub 2015 Nov 18. Glob Chang Biol. 2016. PMID: 26390852 Review.
Cited by
- Maximizing the effectiveness of national commitments to protected area expansion for conserving biodiversity and ecosystem carbon under climate change.
Carroll C, Ray JC. Carroll C, et al. Glob Chang Biol. 2021 Aug;27(15):3395-3414. doi: 10.1111/gcb.15645. Epub 2021 May 10. Glob Chang Biol. 2021. PMID: 33852186 Free PMC article. Review. - Effects of human disturbances on wildlife behaviour and consequences for predator-prey overlap in Southeast Asia.
Lee SXT, Amir Z, Moore JH, Gaynor KM, Luskin MS. Lee SXT, et al. Nat Commun. 2024 Feb 19;15(1):1521. doi: 10.1038/s41467-024-45905-9. Nat Commun. 2024. PMID: 38374248 Free PMC article. - Integrating carbon stocks and landscape connectivity for nature-based climate solutions.
O'Brien P, Gunn JS, Clark A, Gleeson J, Pither R, Bowman J. O'Brien P, et al. Ecol Evol. 2023 Jan 9;13(1):e9725. doi: 10.1002/ece3.9725. eCollection 2023 Jan. Ecol Evol. 2023. PMID: 36636425 Free PMC article. - Predicting building types using OpenStreetMap.
Atwal KS, Anderson T, Pfoser D, Züfle A. Atwal KS, et al. Sci Rep. 2022 Nov 20;12(1):19976. doi: 10.1038/s41598-022-24263-w. Sci Rep. 2022. PMID: 36404337 Free PMC article. - Limited protection and ongoing loss of tropical cloud forest biodiversity and ecosystems worldwide.
Karger DN, Kessler M, Lehnert M, Jetz W. Karger DN, et al. Nat Ecol Evol. 2021 Jun;5(6):854-862. doi: 10.1038/s41559-021-01450-y. Epub 2021 Apr 29. Nat Ecol Evol. 2021. PMID: 33927369
References
- Seymour F, Harris NL. Reducing tropical deforestation. Science. 2019;365:756–757. - PubMed
- Moen J, et al. Eye on the Taiga: removing global policy impediments to safeguard the boreal forest. Conserv. Lett. 2014;7:408–418.
- Scholes, R. et al. IPBES (2018): Summary for policymakers of the assessment report on land degradation and restoration of the Intergovernmental Science-Policy Platform on Biodiversity and Ecosystem Services. (2018).
Publication types
MeSH terms
LinkOut - more resources
Full Text Sources


