A cross-talk between epithelium and endothelium mediates human alveolar-capillary injury during SARS-CoV-2 infection - PubMed (original) (raw)
. 2020 Dec 8;11(12):1042.
doi: 10.1038/s41419-020-03252-9.
Ronghua Luo 2 3, Min Zhang 1 4, Yaqing Wang 1 4, Tianzhang Song 2 3, Tingting Tao 1 4, Zhongyu Li 1, Lin Jin 5, Hongyi Zheng 2 3, Wenwen Chen 1 4, Mengqian Zhao 1 4, Yongtang Zheng 6 7 8, Jianhua Qin 9 10 11 12
Affiliations
- PMID: 33293527
- PMCID: PMC7721862
- DOI: 10.1038/s41419-020-03252-9
A cross-talk between epithelium and endothelium mediates human alveolar-capillary injury during SARS-CoV-2 infection
Peng Wang et al. Cell Death Dis. 2020.
Abstract
COVID-19, caused by SARS-CoV-2, is an acute and rapidly developing pandemic, which leads to a global health crisis. SARS-CoV-2 primarily attacks human alveoli and causes severe lung infection and damage. To better understand the molecular basis of this disease, we sought to characterize the responses of alveolar epithelium and its adjacent microvascular endothelium to viral infection under a co-culture system. SARS-CoV-2 infection caused massive virus replication and dramatic organelles remodeling in alveolar epithelial cells, alone. While, viral infection affected endothelial cells in an indirect manner, which was mediated by infected alveolar epithelium. Proteomics analysis and TEM examinations showed viral infection caused global proteomic modulations and marked ultrastructural changes in both epithelial cells and endothelial cells under the co-culture system. In particular, viral infection elicited global protein changes and structural reorganizations across many sub-cellular compartments in epithelial cells. Among the affected organelles, mitochondrion seems to be a primary target organelle. Besides, according to EM and proteomic results, we identified Daurisoline, a potent autophagy inhibitor, could inhibit virus replication effectively in host cells. Collectively, our study revealed an unrecognized cross-talk between epithelium and endothelium, which contributed to alveolar-capillary injury during SARS-CoV-2 infection. These new findings will expand our understanding of COVID-19 and may also be helpful for targeted drug development.
Conflict of interest statement
The authors declare that they have no conflict of interest.
Figures
Fig. 1. HPAEpiC cells were more susceptible to SARS-CoV-2 infection than HULEC-5a cells.
a Western blot was performed to analyze the expression level of ACE2 and TMPRSS2 in four cell lines. The result was a representative blot from three independent experiments. GAPDH was served as a loading control. b Confocal fluorescent images of cells immunostained for viral Spike protein (viral Spike protein S1 subunit) 72 h post-infection. c Quantification of the percentage of HPAEpiC cells or HULEC-5a cells immunostained by viral Spike protein. Data represent four independent experiments, and more than 1000 cells for each group were quantified. Data were presented as mean ± SEM. Data were analyzed by Student’s t test (***: P < 0.001). d Culture supernatants of HPAEpiC cells or HULEC-5a cells were harvested at indicated time points following SARS-CoV-2 infection to examine the viral load using qRT-PCR for different groups. The average of two independent experiments was shown. Data were presented as mean ± SEM.
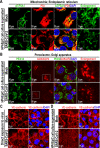
Fig. 2. Organelles of HPAEpiC cells and HULEC-5a cells following SARS-CoV-2 infection.
a Representative images of endoplasmic reticulum immunostained with anti-PDI antibody for mock- or SARS-CoV-2-infected HPAEpiC cells. The white arrows indicated the co-localization of virus particles and endoplasmic reticulum within the host cells. b Representative images of Golgi apparatus immunostained with anti-GORASP2 antibody for mock- or SARS-CoV-2-infected HPAEpiC cells. c Representative images of mitochondria immunostained with anti-ATP5A1 antibody for mock- or SARS-CoV-2-infected HPAEpiC cells. d Representative images of peroxisomes immunostained with anti-PEX14 antibody for mock- or SARS-CoV-2-infected HPAEpiC cells. e Quantification of peroxisome size and density (number/cell) for mock- or infected cells in (d). Data were analyzed by Student’s t test (*: P < 0.05). Data represent four independent experiments, and more than 150 cells for each group were quantified. Data were presented as mean ± SEM. f Representative images of mitochondria and endoplasmic reticulum of mock- or SARS-CoV-2-infected HULEC-5a cells. g Representative images of peroxisomes and Golgi apparatus of mock- or SARS-CoV-2-infected HULEC-5a cells. All results are representative for three independent experiments.
Fig. 3. Organelles of HULEC-5a cells following treatment with culture supernatants from mock- or SARS-CoV-2-infected HPAEpiC cells.
a Representative images of mitochondria and endoplasmic reticulum in HULEC-5a cells treated with mock- or SARS-CoV-2-infected HPAEpiC cell culture supernatants. The mitochondria indicated by white box were enlarged on the right. b Representative images of peroxisomes and Golgi apparatus in HULEC-5a cells treated with mock- or SARS-CoV-2-infected HPAEpiC cell culture supernatants. The Golgi apparatus indicated by white box was enlarged on the right. c Representative images of adherent junctions visualized by VE-cadherin in Mock- or SARS-CoV-2-infected HULEC-5a cells. d Representative images of adherent junctions visualized by VE-cadherin in HULEC-5a cells treated with mock- or SARS-CoV-2-infected HPAEpiC cell culture supernatants. All results represent three independent experiments.
Fig. 4. SARS-CoV-2 infection in an alveolar epithelium/endothelium co-culture system based on transwell.
a A schematic diagram for an alveolar epithelium/endothelium co-culture system based on a transwell chamber. b Western blot was performed to analyze the levels of ACE2, E-cadherin (epithelial cell marker), and VE-cadherin (vascular endothelial cell marker) for HPAEpiC cells and HULEC-5a cells collected from the co-culture system, separately. c Blood-to-alveolus permeability assay of dextran-FITC (10 kDa) was measured on the co-culture system to evaluate the integrity of the alveolar–capillary barrier. Data were presented as mean ± SEM, n = 3. Data were analyzed by Student’s t test (***: P < 0.001). d Western blot was performed to analyze the viral Nucleoprotein (NP) level of HPAEpiC cells and HULEC-5a cells collected from the co-culture system separately following SARS-CoV-2 infection. b, d These results are representative blots from three independent experiments.
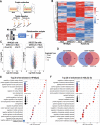
Fig. 5. Proteomic analysis of host cells following SARS-CoV-2 infection based on alveolar co-culture system.
a Schematic diagram of experimental flow for quantitative proteomic analysis based on the alveolar co-culture system. For each treatment, three biological replicates were prepared. b Heatmap showed proteomic changes of cells following SARS-CoV-2 infection. c Volcano plots showed the regulated proteins of cells following SARS-CoV-2 infection. Proteins differentially expressed with fold change over 1.5 and p < 0.05 were marked in color. _P_-values were calculated using a two-sided, unpaired Student’s t test with equal variance assumed (n = 3 independent biological samples). d Venn diagrams showed the differentially expressed proteins shared or unique between each comparison. e Gene Ontology enrichment analysis of DEPs in HPAEpiC cells following SARS-CoV-2 infection based on biological process. f Gene Ontology enrichment analysis of DEPs in HULEC-5a cells following SARS-CoV-2 infection based on biological process. e, f The vertical axis shows the top 20 enriched biological processes, and the horizontal axis represents rich factor. The color and size of the dots represent the range of the _P_-value and the number of DEGs mapped to the indicated GO terms, respectively. A two-tailed Fisher’s exact test was employed to test the enrichment of the differentially expressed protein against all identified proteins. The GO with a corrected _p_-value < 0.05 is considered significant.
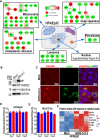
Fig. 6. Mitochondrion was a primary target organelle by SARS-CoV-2 in host cells.
a PPI (protein–protein interaction) networks of the DEPs within different sub-cellular compartments in HPAEpiC cells following SARS-CoV-2 infection. The red boxes indicated the DEPs shared in both HPAEpiC and Caco-2 cells following SARS-CoV-2 infection. Data of Caco-2 cells (24 h after infection) was from published literature by Bojkova et al.. Proteins differentially expressed in Caco-2 (24 h post infeciton) with fold change over 1.3 and p < 0.05 were identified as DEPs (Supplementary Table 3). The color represents the log2 ratio. PPI network was constructed based on STRING database with the interaction score set to high confidence (0.700). **b** Western blot was performed to analyze the protein levels of TIMM23 and NDUFA4 in mock- and SARS-CoV-2-infected HPAEpiC cells. The result is a representative blot from three independent experiments. **c** Confocal fluorescent images of Mock- or SARS-CoV-2-infected HPAEpiC cells stained by mitoSox Red dye. Viral Spike protein indicated the infected cells. **d**, **e** Culture supernatants of HPAEpiC cells or HULEC-5a cells were harvested at indicated time points following SARS-CoV-2 infection to examine the extracellular ROS level using an ELISA kit for different groups. The results represent three independent experiments. Data were presented as mean ± SEM. The extracellular ROS level of mock-infected group at each time point was normalized to 1. **f** Heatmap showed the up-regulated proteins related to responses to oxidative stress in HPAEpiC cells following SARS-CoV-2 infection. Color indicates the abundance of a protein. All up-regulated proteins were searched based on GO annotation keywords (response to oxidative stress or response to reactive oxygen species). Fold change >1.5, _P_-value < 0.05 in (d).
Fig. 7. TEM analysis of mock- and SARS-CoV-2-infected cells from alveolar co-culture system.
a TEM micrographs of HPAEpiC cells of mock-infected group. a1 The overall image of the HPAEpiC cell. The area indicated by black box was enlarged in a2. a2 The micrograph of mitochondria (M) of HPAEpiC cell. a3 The micrograph of smooth endoplasmic reticulum (ER) of HPAEpiC cell. a4 The micrograph of Golgi apparatus (G) of HPAEpiC cell. a5 The micrograph of lamellar body (LB) within cell body. b TEM micrographs of HPAEpiC cells of SARS-CoV-2-infected group. b1 The overall image of the infected cell. The area indicated by the black box is enlarged in b2. b2 The micrograph of clusters of virus particles (V) within cell body. b3 Enlarged image of virus indicated in b2. b4 A large amount of autophagic vacuoles (AV) in the infected HPAEpiC cells. b5 The micrograph of fragmented mitochondria (M) in the infected HPAEpiC cells. c TEM micrographs of HULEC-5a cells of mock-infected group. c1 The overall image of the HULEC-5a cells. The areas indicated by black boxes were enlarged in c2 and c3, respectively. c2 The micrograph of mitochondria in the mock-infected HULEC-5a cells. c3 The micrograph of rough endoplasmic reticulum (ER) in mock-infected HULEC-5a cells. d TEM micrographs of HULEC-5a cells of SARS-CoV-2-infected group. d1 The overall image of the HULEC-5a cells. The areas indicated by black box were enlarged in d2. d2 The micrograph of fragmented mitochondria (M) with swollen cristae in HULEC-5a cells of SARS-CoV-2-infected group. d3 The micrograph of dilated rough endoplasmic reticulum (ER) in HULEC-5a cells of SARS-CoV-2-infected group. Nu: nucleus; Mv: microvilli; M: mitochondria; ER: endoplasmic reticulum; G: Golgi apparatus; LB: lamellar body; V: virus particle; AV: autophagic vacuole. Three independent experiments were performed (n = 3).
Fig. 8. Daurisoline could inhibit SARS-CoV-2 replication in Vero E6 cells and HPAEpiC cells.
a Antiviral assay showed inhibition of viral replication in dependency of Daurisoline concentration in Vero E6 cells (n = 2). b Antiviral assay showed inhibition of viral replication in dependency of Daurisoline concentration in HPAEpiC cells (n = 2).
Similar articles
- Effects of SARS-CoV-2 on Cardiovascular System: The Dual Role of Angiotensin-Converting Enzyme 2 (ACE2) as the Virus Receptor and Homeostasis Regulator-Review.
Aleksova A, Gagno G, Sinagra G, Beltrami AP, Janjusevic M, Ippolito G, Zumla A, Fluca AL, Ferro F. Aleksova A, et al. Int J Mol Sci. 2021 Apr 26;22(9):4526. doi: 10.3390/ijms22094526. Int J Mol Sci. 2021. PMID: 33926110 Free PMC article. Review. - SARS-CoV-2 Spike Protein Destabilizes Microvascular Homeostasis.
Panigrahi S, Goswami T, Ferrari B, Antonelli CJ, Bazdar DA, Gilmore H, Freeman ML, Lederman MM, Sieg SF. Panigrahi S, et al. Microbiol Spectr. 2021 Dec 22;9(3):e0073521. doi: 10.1128/Spectrum.00735-21. Epub 2021 Dec 22. Microbiol Spectr. 2021. PMID: 34935423 Free PMC article. - SARS-CoV-2 infection of primary human lung epithelium for COVID-19 modeling and drug discovery.
Mulay A, Konda B, Garcia G Jr, Yao C, Beil S, Villalba JM, Koziol C, Sen C, Purkayastha A, Kolls JK, Pociask DA, Pessina P, de Aja JS, Garcia-de-Alba C, Kim CF, Gomperts B, Arumugaswami V, Stripp BR. Mulay A, et al. Cell Rep. 2021 May 4;35(5):109055. doi: 10.1016/j.celrep.2021.109055. Epub 2021 Apr 13. Cell Rep. 2021. PMID: 33905739 Free PMC article. - Host metabolism dysregulation and cell tropism identification in human airway and alveolar organoids upon SARS-CoV-2 infection.
Pei R, Feng J, Zhang Y, Sun H, Li L, Yang X, He J, Xiao S, Xiong J, Lin Y, Wen K, Zhou H, Chen J, Rong Z, Chen X. Pei R, et al. Protein Cell. 2021 Sep;12(9):717-733. doi: 10.1007/s13238-020-00811-w. Epub 2020 Dec 12. Protein Cell. 2021. PMID: 33314005 Free PMC article. - Endothelium Infection and Dysregulation by SARS-CoV-2: Evidence and Caveats in COVID-19.
Bernard I, Limonta D, Mahal LK, Hobman TC. Bernard I, et al. Viruses. 2020 Dec 26;13(1):29. doi: 10.3390/v13010029. Viruses. 2020. PMID: 33375371 Free PMC article. Review.
Cited by
- Exploring the Role of ROCK Inhibition in Corneal Edema Through Crosstalk Between Epithelial and Endothelial Cells.
Yi LY, Hsieh HH, Lin ZQ, Hung KF, Sun YC. Yi LY, et al. J Ophthalmol. 2024 Nov 5;2024:9381303. doi: 10.1155/2024/9381303. eCollection 2024. J Ophthalmol. 2024. PMID: 39534682 Free PMC article. Review. - COVID-19 shed light on Virchow's law of thrombosis.
Daisley H, Acco O, Daisley M, George D, Paul L, Rampersad A, Daisley J. Daisley H, et al. Autops Case Rep. 2024 Aug 28;14:e2024512. doi: 10.4322/acr.2024.512. eCollection 2024. Autops Case Rep. 2024. PMID: 39372069 Free PMC article. - Mitochondrial antioxidants abate SARS-COV-2 pathology in mice.
Guarnieri JW, Lie T, Albrecht YES, Hewin P, Jurado KA, Widjaja GA, Zhu Y, McManus MJ, Kilbaugh TJ, Keith K, Potluri P, Taylor D, Angelin A, Murdock DG, Wallace DC. Guarnieri JW, et al. Proc Natl Acad Sci U S A. 2024 Jul 23;121(30):e2321972121. doi: 10.1073/pnas.2321972121. Epub 2024 Jul 15. Proc Natl Acad Sci U S A. 2024. PMID: 39008677 Free PMC article. - Mitochondria in COVID-19: from cellular and molecular perspective.
Rurek M. Rurek M. Front Physiol. 2024 Jun 21;15:1406635. doi: 10.3389/fphys.2024.1406635. eCollection 2024. Front Physiol. 2024. PMID: 38974521 Free PMC article. Review. - Secretome profiling of human epithelial cells exposed to cigarette smoke extract and their effect on human lung microvascular endothelial cells.
Seenak P, Nernpermpisooth N, Kumphune S, Songjang W, Jiraviriyakul A, Jumroon N, Pankhong P, Roytrakul S, Thaisakun S, Phaonakrop N, Nuengchamnong N. Seenak P, et al. Sci Rep. 2024 Jun 14;14(1):13740. doi: 10.1038/s41598-024-64717-x. Sci Rep. 2024. PMID: 38877184 Free PMC article.
References
- Wichmann, D. et al. Autopsy findings and venous thromboembolism in patients With COVID-19. Ann. Intern. Med.10.7326/M20-2003 (2020). - PubMed
Publication types
MeSH terms
Substances
LinkOut - more resources
Full Text Sources
Medical
Miscellaneous


