Myonuclear content regulates cell size with similar scaling properties in mice and humans - PubMed (original) (raw)
Myonuclear content regulates cell size with similar scaling properties in mice and humans
Kenth-Arne Hansson et al. Nat Commun. 2020.
Abstract
Muscle fibers are the largest cells in the body, and one of its few syncytia. Individual cell sizes are variable and adaptable, but what governs cell size has been unclear. We find that muscle fibers are DNA scarce compared to other cells, and that the nuclear number (N) adheres to the relationship N = aVb where V is the cytoplasmic volume. N invariably scales sublinearly to V (b < 1), making larger cells even more DNA scarce. N scales linearly to cell surface in adult humans, in adult and developing mice, and in mice with genetically reduced N, but in the latter the relationship eventually fails when they reach adulthood with extremely large myonuclear domains. Another exception is denervation-atrophy where nuclei are not eliminated. In conclusion, scaling exponents are remarkably similar across species, developmental stages and experimental conditions, suggesting an underlying scaling law where DNA-content functions as a limiter of muscle cell size.
Conflict of interest statement
The authors declare no competing interests.
Figures
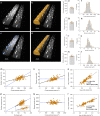
Fig. 1. Nuclear number scales sublinearly to cell volume and linearly to fiber surface in mice labeled in vivo.
a–d Representative image from cells (n = 96) from the EDL muscle injected with a fluorescent dye that is taken up by the nuclei (a). b Background fluorescence was used to visualize the fiber volumes (orange). To calculate the average cross-sectional area and fiber volume the perimeter was outlined manually at 20–50 μm intervals. c Nuclear number was quantified by assigning a spot (blue) to each nucleus manually. d Rendered fiber (b) merged with the spots (c). e, g, i, and k mean value per muscle (n = 6), f, h, j, and l show the frequency distribution per fiber (n = 96), for cross-sectional area (e, f), nuclear number per mm (g, h), domain volumes (i, j), and surface domains (k, l). m Nuclear number per mm versus cross-sectional area were statistically tested against linear scaling (b = 1, dashed blue line). Comparison of fits gave a _F_-value of 53.74 (p < 0.0001). n Nuclear domains versus cross-sectional area were statistically tested against the dashed line which indicate a fixed scaling (b = 0). Comparison of fits gave a _F_-value of 65.80 (p < 0.0001). o Nuclear number versus cell volume plotted and analyzed in log–log space gave a slope of b = 0.73 (95% CI: 0.65, 0.80). p Nuclear number per mm versus the fiber perimeter were statistically tested against a linear relationship (dashed blue line). Comparison of fits yielded a _F_-value of 0.1249 (p = 0.7245). q Surface domains versus cross-sectional area tested against a horizontal slope (b = 0, dashed blue line), gave an F- value of 0.3070 (p = 0.5808). r Nuclear number versus surface area plotted in log–log space gave a slope of b = 0.95 (95% CI: 0.86, 1.04). Error bars in e, g, i, and k represent the 95% CI’s, while the nonlinear lines (orange) in f, h, j, and l were fitted by a Gaussian function. In m–r regression lines were fitted with an OLS method with (1, 94) degrees of freedom and compared with extra sum-of-squares _F_-test. Scale bars, 40 μm in a–d. Source data are provided as a Source Data file.
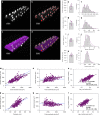
Fig. 2. Scaling properties of adult human muscle are similar to mice in spite of differences in absolute numbers.
a–d Representative image from muscle cells (n = 267) from the human v. lateralis labeled with DAPI to visualize nuclei (a). b Nuclear number was quantified by assigning a spot (red) to each nucleus. c Background fluorescence was used to automatically 3-D render the cells´ morphology. d Shows a 3-D rendered transparent muscle cell with its nuclei. e, g, i, and k Highlights the mean (arithmetic) value per muscle (n = 7), while f, h, j and l show the frequency distribution per fiber (n = 267), for cross-sectional area (e, f), nuclear number per mm (g, h), domain volumes (i, j) and surface domains (k, l). m Nuclear number per mm versus cross-sectional area tested against linear scaling (b = 1, dashed blue line). Comparison of fits gave a _F_-value of 82.39 (p < 0.0001). n Nuclear domains versus cross-sectional area were tested against the dashed line which indicate a fixed scaling (b = 0). Comparison of fits gave the _F_-value of 101.1 (p < 0.0001). o Nuclear number versus cell volume plotted and analyzed in log–log space gave a slope of b = 0.66 (95% CI: 0.60, 0.72). p Nuclear number per mm versus the fiber perimeter were statistically tested against a linear relationship (dashed blue line). Comparison of fits yielded a _F_-value of 5.967 (p = 0.0152). q Surface domains versus cross-sectional area tested against a horizontal slope (b = 0, dashed blue line), gave an _F_-value of 29.55 (p < 0.0001). r Nuclear number versus surface area plotted in log–log space gave a slope of b = 1.16 (95% CI: 1.03, 1.28). Error bars in e, g, i, and k represent the 95% CI’s, while the non-linear lines (purple) in h, j, and l were fitted by a Gaussian function, and f by a locally weighted smoothing regression (LOWESS). In m–r regression lines were fitted with an OLS method with (1, 265) degrees of freedom and compared with extra sum-of-squares _F_-test. Scale bars, 40 μm in a–d. Source data are provided as a Source Data file.
Fig. 3. Relationship between nuclear number and cell size after 14 days of denervation.
a–d Highlights the mean (arithmetic) value per muscle, while e–h shows the frequency distribution per fiber, for cross-sectional area (a, e), nuclear number per mm (b, f), domain volumes (c, g), and surface domains (d, h) in denervated muscle (green) and normal muscle (orange, these are the same data as presented in Fig. 1). Asterisks (*) indicate significantly different means based on results from two-sided Welch’s _t_-test: a (p < 0.0001, t = 7.707, and df = 9), b (p = 0.9719, t = 0.03611, and df = 10), c (p = 0.0001, t = 6.220, and df = 9) and d (p < 0.0001, t = 5.857, and df = 12). i–n Relationships of nuclear number and fiber size analyzed for denervated muscle (green) compared to normal muscles (orange). Statistics for the normal muscles are presented in Fig. 1. i Nuclear number per mm versus cross-sectional area for denervated fibers (solid black line) tested against a linear scaling (b = 1, green solid line). Comparison of fits gave a _F_-value of 109.9 (p < 0.0001). j Domain volumes versus cross-sectional area were tested against the solid green line (b = 0). Comparison of fits gave an _F_-value of 153.1 (p < 0.0001). k Nuclear number versus cell volume plotted and analyzed in log–log space gave a slope of b = 0.36 (95% CI: 0.28, 0.44). l Nuclear number per mm versus the fiber perimeter were statistically tested against a linear relationship (solid green line). Comparison of fits yielded a _F_-value of 11.51 (p = 0.0010). m Surface domains versus cross-sectional area tested against a horizontal slope (b = 0, solid green line), gave an _F_-value of 23.85 (p < 0.0001). n Nuclear number versus surface area plotted in log–log space gave a slope of b = 0.64 (95% CI: 0.51, 0.77). In i–n regression lines were fitted with an OLS method with (1, 92) degrees of freedom and compared with the extra sum-of-squares _F_-test. n = 8 (denervated) and 6 (normal) muscles for a–d, while n = 94 (denervated) and 96 (normal) cells for e–h. Error bars in a–d represent the 95% CI and the curves in e–h were fitted by a Gaussian function. Source data are provided as a Source Data file.
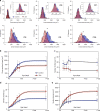
Fig. 4. Inhibiting myonuclear accretion genetically causes smaller muscle fibers and larger myonuclear domains during development.
a Frequency distribution of cross-sectional area from P13 to P150 between normal EDL cells (blue, dashed Gaussian line) and Δ2_w_ cells (red, solid Gaussian line). Inset in P13–P27 shows the zoomed distribution. Asterisks (*) indicate nested two-sided t_-test results: P35 (p = 0.0075, t = 3.56, and df = 8), P42 (p = 0.0067, t = 4.45, and df = 5) and P150 (p < 0.0001, t = 6.29, and df = 162), while for the remaining age-matched comparisons: P13 (p = 0.4838, t = 0.7708, and df = 4), P20 (p = 0.2830, t = 1.239, and df = 4) and P27 (p = 0.8157, t = 0.2488, and df = 4). b–e Size-related parameters plotted against age for cross-sectional area (b), nuclear number (c), nuclear domains (d), and fiber surface domains (e). Solid lines in b and d were fitted to data using a logistic growth model, while e was fitted by an exponential plateau function. Dashed lines represent 95 % CI and each data point represents the mean value with the standard deviation as error bars. df = degrees of freedom. All data in a–e were calculated from the following number of control cells: P13 = 74 cells, P20 = 50 cells, P27 = 80 cells, P35 = 135 cells, P42 = 89 cells, and P150 = 92 cells. The number of myomaker Δ2_w cells were; P13 = 59 cells, P20 = 94 cells, P27 = 92 cells, P35 = 88 cells, P42 = 107 cells, and P150 = 72 cells. Source data are provided as a Source Data file.
Fig. 5. Scaling behavior is retained during post-natal growth, also after inhibiting myonuclear accretion genetically.
a Nuclear number versus cell volume in log–log space plotted from P13 to P150 for normal EDL cells (blue) and Δ2w cells (red). Solid lines (control) and dashed lines (Δ2_w_) were fitted after an OLS regression. Between group comparisons of the scaling exponent gave a p_-value for each age as: P13 (p = 0.9027), P20 (p = 0.7705), P27 (p = 0.6204), P35 (p = 0.4528), P42 (p = 0.6731), and P150 (p = 0.0295, * statistically different at p < 0.05). The log–log model after fitting for normal cells is highlighted by y, while y′ represent the equation for Δ2_w cells. b Nuclear number versus cell volume in log–log space plotted from P13 to P150 for normal EDL cells (blue) and Δ2_w_ cells (red). Solid lines (control) and dashed lines (Δ2_w_) were fitted after an OLS regression. Comparisons of the scaling exponent between the two groups gave a p_-value for each age as: P13 (p = 0.5471), P20 (p = 0.8265), P27 (p = 0.3758), P35 (p = 0.5246), P42 (p = 0.2006) and P150 (p = 0.0170, *statistically different at p < 0.05). The log-log model after fitting for normal cells is highlighted by y, while y ′ represent the equation for Δ2_w cells. In a and b, the number of control cells for each age were: P13 = 74 cells, P20 = 50 cells, P27 = 80 cells, P35 = 135 cells, P42 = 89 cells, and P150 = 92 cells. The number of myomaker Δ2_w_ cells were; P13 = 59 cells, P20 = 94 cells, P27 = 92 cells, P35 = 88 cells, P42 = 107 cells and P150 = 72 cells. All _p_-values were extracted from the extra sum-of-squares _F_-test. Source data are provided as a Source Data file.
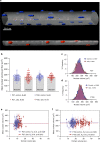
Fig. 6. Nuclear volume is fixed across development and scale invariant with domain volumes.
a Nuclei and fiber 3D rendered to illustrate the difference in nuclear number and fiber size between control fibers (blue nuclei) and Δ2_w_ fibers (red nuclei). Nuclear volume was determined based on fluorescence from DAPI stained nuclei. Nuclei that were positioned at fiber ends and only partially visualized were excluded from quantification. b Mean nuclear volume per fiber at P27 and P150 between control (blue) and Δ2_w_ (red) were statistical non-significant when tested for differences among group means with a Brown–Forsythe (_F_-value of 0.93333 (DF = 3, df = 223), p = 0.4254) and Welch’s ANOVA test (_F_-value of 1.049 (DF = 3, df = 159), p = 0.3756). c Frequency distribution of nuclear volume plotted independent of fiber at P27 and P150 (d). Mean nuclear volume versus domain volume at P27 (e) and P150 (f) were statistically tested against a horizontal slope (b = 0) which gave a F_-value of 1.825 and 1.339 at P27 for controls and Δ2_w fibers respectively. At P150 the F_-value were 2.434 and 0.3173 for the Δ2_w. All comparisons were statically non-significant with the corresponding _p_-value as highlighted in e and f. Source data are provided as a Source Data file.
Fig. 7. Scaling relationship of nuclear number and cell volume summarized.
a All scaling exponents extracted with their 95% CI**. b** Nuclear number versus cell volume plotted in log–log space for mice (log10 [nuclear number] = −2.78 + 0.73 log10 [cell volume]), humans (log10 [nuclear number] = −2.19 + 0.66 log10 [cell volume]), myomaker control cells (log10 [nuclear number] = −1.97 + 0.61 log10 [cell volume]), Δ2_w_ cells without P150 (log10 [nuclear number] = −2.60 + 0.65 log10 [cell volume]), Δ2w P150 (log10 [nuclear number] = −1.4 + 0.44 log10 [cell volume]) and denervated cells (log10 [nuclear number] = −0.67 + 0.36 log10 [cell volume]).
Fig. 8. Model for regulation of muscle fibers size related to scaling relationship.
Our model proposes that the number of myonuclei in a fiber segment is determined by growth signals during development and hypertrophy. The number of nuclei and a setpoint a (which is a productivity number for each nucleus) determine cellular dimensions. The number of nuclei scales invariably sublinearly to cell volume (b < 1), but linearly to cell surface (b = 1).
Similar articles
- Natural occurrence of myofiber cytoplasmic enlargement accompanied by decrease in myonuclear number.
Wada KI, Katsuta S, Soya H. Wada KI, et al. Jpn J Physiol. 2003 Apr;53(2):145-50. doi: 10.2170/jjphysiol.53.145. Jpn J Physiol. 2003. PMID: 12877770 - Nuclear numbers in syncytial muscle fibers promote size but limit the development of larger myonuclear domains.
Cramer AAW, Prasad V, Eftestøl E, Song T, Hansson KA, Dugdale HF, Sadayappan S, Ochala J, Gundersen K, Millay DP. Cramer AAW, et al. Nat Commun. 2020 Dec 8;11(1):6287. doi: 10.1038/s41467-020-20058-7. Nat Commun. 2020. PMID: 33293533 Free PMC article. - Essential role of satellite cells in the growth of rat soleus muscle fibers.
Kawano F, Takeno Y, Nakai N, Higo Y, Terada M, Ohira T, Nonaka I, Ohira Y. Kawano F, et al. Am J Physiol Cell Physiol. 2008 Aug;295(2):C458-67. doi: 10.1152/ajpcell.00497.2007. Epub 2008 Jun 4. Am J Physiol Cell Physiol. 2008. PMID: 18524941 - Scaling of nuclear numbers and their spatial arrangement in skeletal muscle cell size regulation.
Hansson KA, Eftestøl E. Hansson KA, et al. Mol Biol Cell. 2023 Jul 1;34(8):pe3. doi: 10.1091/mbc.E22-09-0424. Mol Biol Cell. 2023. PMID: 37339435 Free PMC article. Review. - Myonuclear domains in muscle adaptation and disease.
Allen DL, Roy RR, Edgerton VR. Allen DL, et al. Muscle Nerve. 1999 Oct;22(10):1350-60. doi: 10.1002/(sici)1097-4598(199910)22:10<1350::aid-mus3>3.0.co;2-8. Muscle Nerve. 1999. PMID: 10487900 Review.
Cited by
- Lineage tracing of nuclei in skeletal myofibers uncovers distinct transcripts and interplay between myonuclear populations.
Sun C, Swoboda CO, Morales FM, Calvo C, Petrany MJ, Parameswaran S, VonHandorf A, Weirauch MT, Lepper C, Millay DP. Sun C, et al. Nat Commun. 2024 Oct 30;15(1):9372. doi: 10.1038/s41467-024-53510-z. Nat Commun. 2024. PMID: 39477931 Free PMC article. - Spatial multi-omics in whole skeletal muscle reveals complex tissue architecture.
Martínez Mir C, Pisterzi P, De Poorter I, Rilou M, van Kranenburg M, Heijs B, Alemany A, Sage F, Geijsen N. Martínez Mir C, et al. Commun Biol. 2024 Oct 5;7(1):1272. doi: 10.1038/s42003-024-06949-1. Commun Biol. 2024. PMID: 39369093 Free PMC article. - Temporal expression of mitochondrial life cycle markers during acute and chronic overload of rat plantaris muscles.
Hyatt JK, Lu EJ, McCall GE. Hyatt JK, et al. Front Physiol. 2024 Aug 30;15:1420276. doi: 10.3389/fphys.2024.1420276. eCollection 2024. Front Physiol. 2024. PMID: 39282091 Free PMC article. - Skeletal muscle: molecular structure, myogenesis, biological functions, and diseases.
Feng LT, Chen ZN, Bian H. Feng LT, et al. MedComm (2020). 2024 Jul 10;5(7):e649. doi: 10.1002/mco2.649. eCollection 2024 Jul. MedComm (2020). 2024. PMID: 38988494 Free PMC article. Review. - Characterization of Skeletal Muscle Regeneration Revealed a Novel Growth Network Induced by Molecular Acupuncture-like Transfection.
Zádor E. Zádor E. Biomolecules. 2024 Mar 19;14(3):363. doi: 10.3390/biom14030363. Biomolecules. 2024. PMID: 38540781 Free PMC article. Review.
References
- West GB, Brown JH. Life’s universal scaling laws. Phys. Today. 2004;57:36–42. doi: 10.1063/1.1809090. - DOI
Publication types
MeSH terms
Substances
LinkOut - more resources
Full Text Sources


