SoupX removes ambient RNA contamination from droplet-based single-cell RNA sequencing data - PubMed (original) (raw)
SoupX removes ambient RNA contamination from droplet-based single-cell RNA sequencing data
Matthew D Young et al. Gigascience. 2020.
Abstract
Background: Droplet-based single-cell RNA sequence analyses assume that all acquired RNAs are endogenous to cells. However, any cell-free RNAs contained within the input solution are also captured by these assays. This sequencing of cell-free RNA constitutes a background contamination that confounds the biological interpretation of single-cell transcriptomic data.
Results: We demonstrate that contamination from this "soup" of cell-free RNAs is ubiquitous, with experiment-specific variations in composition and magnitude. We present a method, SoupX, for quantifying the extent of the contamination and estimating "background-corrected" cell expression profiles that seamlessly integrate with existing downstream analysis tools. Applying this method to several datasets using multiple droplet sequencing technologies, we demonstrate that its application improves biological interpretation of otherwise misleading data, as well as improving quality control metrics.
Conclusions: We present SoupX, a tool for removing ambient RNA contamination from droplet-based single-cell RNA sequencing experiments. This tool has broad applicability, and its application can improve the biological utility of existing and future datasets.
Keywords: decontamination; pre-processing; scRNA-seq.
© The Author(s) 2020. Published by Oxford University Press GigaScience.
Conflict of interest statement
The authors declare that they have no competing interests.
Figures
Figure 1:
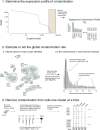
A visual summary of the SoupX method, using data from the PBMC dataset.
Figure 2:
The properties of the cell-free mRNA soup as determined using species-mixing datasets. A, The log10 ratio of the number of UMIs mapping to human and mouse mRNAs for each droplet in the species-mixing dataset (10X). Droplets determined to contain cells by cellranger are marked in black. B, The correlation of the counts in the background compared to counts averaged across cells for each gene. Counts have been subsampled so that the total number of counts in the background and averaged cell population are the same. C, The estimated contamination fraction as a function of number of UMIs in each droplet in individual cells in the species-mixing dataset. Red and blue dots represent cells from the 10X/DropSeq experiments, respectively. The distribution on the left shows the marginal distribution across all cells. D, The fractional change in contaminating and genuine expression levels after applying SoupX for the 2 technologies. The distribution across cells is summarized by box plots, where the central line is the median, box boundaries are the first and third quartiles, and the whiskers extend to 1.5 times the interquartile range.
Figure 3:
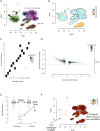
The PBMC dataset and how it changes when background correction is applied. A, A tSNE representation of the data, with cluster boundaries shown by density contours and shaded according to the cell type they represent. MNP: mononuclear phagocytes; NK: natural killer cells. B, The same tSNE representation, but cells are now coloured by their rate of expression of immunoglobulin (IG) genes compared to the rate at which IG is expressed in the background on a log10 scale. Positive values correspond to higher IG expression in a cell than in the background, with values significantly >0 only possible if the cell endogenously expresses IG. The density contours of the clusters with no cell that endogenously expresses IG (as determined by a Poisson test) are marked in boldface and used to estimate the global contamination ratio. C, The fraction of cells shared between clusters determined with the same parameters before and after application of SoupX. D, The improvement in marker specificity following application of SoupX. All genes that are markers of a cluster either before or after correction are identified and their expression log fold change (FC) relative to the clusters they do not mark is calculated before and after correction. The y-axis of this plot shows the fractional change in log FC after applying SoupX for all genes. Genes are grouped into bins for ease of representation, with the number of genes in each bin given by the colour scale. The marginal distribution across all genes is shown on the right and the dotted line corresponds to no change in marker specificity after correction. E, The improvement in marker sensitivity for the gene LYZ, which is a marker for mononuclear phagocytes (MNPs). The corrected and uncorrected expression levels are shown split by cells labelled as MNPs and all others. F, This same change in expression shown on the tSNE map, where the colour scale represents the fraction of LYZ expression that has been removed by SoupX.
Figure 4:
The application of SoupX to complex, multi-channel data. A, A tSNE representation of the data, with cluster boundaries shown by density contours and shaded according to the cell type they represent. ccRCC: clear-cell renal cell carcinoma cells; pRCC: papillary cell renal cell carcinoma cells; RBC: red blood cells; MNP: mononuclear phagocytes. B, The fraction of cells shared between clusters determined with the same parameters before and after application of SoupX. C, The improvement in marker sensitivity for the gene HBB, which is a marker for red blood cells. The colour scale represents the fraction of HBB expression that has been removed by SoupX. D, Same as C but for COL1A1. E, The cross-batch entropy before and after SoupX has been applied. The entropy measures the level of local mixing (100 nearest neighbours) for 100 cells selected from each cluster [20]. F, The distribution of HBB expression (y-axis, log scale) in the fetal liver data by cell type (x-axis), with the erythroid lineage marked in boldface. For each cell type, the expression distribution is shown before (right) and after (left) application of SoupX. Dots represent individual cells and box plots show the distribution of expression values where the central line is the median, box boundaries are the first and third quartiles, and the whiskers extend to 1.5 times the interquartile range.
Similar articles
- FastCAR: fast correction for ambient RNA to facilitate differential gene expression analysis in single-cell RNA-sequencing datasets.
Berg M, Petoukhov I, van den Ende I, Meyer KB, Guryev V, Vonk JM, Carpaij O, Banchero M, Hendriks RW, van den Berge M, Nawijn MC. Berg M, et al. BMC Genomics. 2023 Nov 29;24(1):722. doi: 10.1186/s12864-023-09822-3. BMC Genomics. 2023. PMID: 38030970 Free PMC article. - DIMM-SC: a Dirichlet mixture model for clustering droplet-based single cell transcriptomic data.
Sun Z, Wang T, Deng K, Wang XF, Lafyatis R, Ding Y, Hu M, Chen W. Sun Z, et al. Bioinformatics. 2018 Jan 1;34(1):139-146. doi: 10.1093/bioinformatics/btx490. Bioinformatics. 2018. PMID: 29036318 Free PMC article. - SiftCell: A robust framework to detect and isolate cell-containing droplets from single-cell RNA sequence reads.
Xi J, Park SR, Lee JH, Kang HM. Xi J, et al. Cell Syst. 2023 Jul 19;14(7):620-628.e3. doi: 10.1016/j.cels.2023.06.002. Cell Syst. 2023. PMID: 37473732 Free PMC article. - Scanorama: integrating large and diverse single-cell transcriptomic datasets.
Hie BL, Kim S, Rando TA, Bryson B, Berger B. Hie BL, et al. Nat Protoc. 2024 Aug;19(8):2283-2297. doi: 10.1038/s41596-024-00991-3. Epub 2024 Jun 6. Nat Protoc. 2024. PMID: 38844552 Free PMC article. Review. - Impact of single-cell RNA sequencing on understanding immune regulation.
Hu X, Zhou X. Hu X, et al. J Cell Mol Med. 2022 Sep;26(17):4645-4657. doi: 10.1111/jcmm.17493. Epub 2022 Jul 30. J Cell Mol Med. 2022. PMID: 35906816 Free PMC article. Review.
Cited by
- Transcriptional analysis of cystic fibrosis airways at single-cell resolution reveals altered epithelial cell states and composition.
Carraro G, Langerman J, Sabri S, Lorenzana Z, Purkayastha A, Zhang G, Konda B, Aros CJ, Calvert BA, Szymaniak A, Wilson E, Mulligan M, Bhatt P, Lu J, Vijayaraj P, Yao C, Shia DW, Lund AJ, Israely E, Rickabaugh TM, Ernst J, Mense M, Randell SH, Vladar EK, Ryan AL, Plath K, Mahoney JE, Stripp BR, Gomperts BN. Carraro G, et al. Nat Med. 2021 May;27(5):806-814. doi: 10.1038/s41591-021-01332-7. Epub 2021 May 6. Nat Med. 2021. PMID: 33958799 Free PMC article. - Obesity results in adipose tissue T cell exhaustion.
Porsche CE, Delproposto JB, Geletka L, O'Rourke R, Lumeng CN. Porsche CE, et al. JCI Insight. 2021 Apr 22;6(8):e139793. doi: 10.1172/jci.insight.139793. JCI Insight. 2021. PMID: 33724954 Free PMC article. - Using blood transcriptome analysis for Alzheimer's disease diagnosis and patient stratification.
Zhong H, Zhou X, Uhm H, Jiang Y, Cao H, Chen Y, Mak TTW, Lo RMN, Wong BWY, Cheng EYL, Mok KY, Chan ALT, Kwok TCY, Mok VCT, Ip FCF, Hardy J, Fu AKY, Ip NY. Zhong H, et al. Alzheimers Dement. 2024 Apr;20(4):2469-2484. doi: 10.1002/alz.13691. Epub 2024 Feb 7. Alzheimers Dement. 2024. PMID: 38323937 Free PMC article. - Spatial and Single Cell Mapping of Castleman Disease Reveals Key Stromal Cell Types and Cytokine Pathways.
Smith D, Eichinger A, Rech A, Wang J, Esteva E, Seyedian A, Yang X, Zhang M, Martinez D, Tan K, Luo M, Park C, Reizis B, Pillai V. Smith D, et al. bioRxiv [Preprint]. 2024 Sep 9:2024.09.09.609717. doi: 10.1101/2024.09.09.609717. bioRxiv. 2024. PMID: 39314418 Free PMC article. Preprint. - Epigenetic dysregulation in Alzheimer's disease peripheral immunity.
Ramakrishnan A, Piehl N, Simonton B, Parikh M, Zhang Z, Teregulova V, van Olst L, Gate D. Ramakrishnan A, et al. Neuron. 2024 Apr 17;112(8):1235-1248.e5. doi: 10.1016/j.neuron.2024.01.013. Epub 2024 Feb 9. Neuron. 2024. PMID: 38340719
References
- Zilionis R, Nainys J, Veres A, et al. Single-cell barcoding and sequencing using droplet microfluidics. Nat Protoc. 2016;12(1):44–73. - PubMed
Publication types
MeSH terms
Substances
LinkOut - more resources
Full Text Sources
Other Literature Sources


