Genetic Diversity of Bubalus bubalis in Germany and Global Relations of Its Genetic Background - PubMed (original) (raw)
doi: 10.3389/fgene.2020.610353. eCollection 2020.
Saber Qanbari 1, Rayner González-Prendes 2, Julia Brenmoehl 1, María Gracia Luigi-Sierra 3, Michael Theerkorn 4, Marc-André Fiege 5, Heike Pilz 6, Adrian Bota 7, Livia Vidu 8, Csaba Horwath 9, László Haraszthy 10, Pencho Penchev 11, Yordanka Ilieva 11, Tzonka Peeva 11, Wolfgang Lüpcke 12, René Krawczynski 13, Klaus Wimmers 1, Manfred Thiele 14, Andreas Hoeflich 1
Affiliations
- PMID: 33552127
- PMCID: PMC7863760
- DOI: 10.3389/fgene.2020.610353
Genetic Diversity of Bubalus bubalis in Germany and Global Relations of Its Genetic Background
Antonia Noce et al. Front Genet. 2021.
Abstract
This is the first study to explore the genetic diversity and population structure of domestic water buffalo (Bubalus bubalis) in Germany and their potential relations to herds in other parts of Europe or worldwide. To this end, animals from different herds in Germany, Bulgaria, Romania, and Hungary were genotyped and compared to genotypes from other populations with worldwide distribution and open to the public. The pilot study analyzed population structure, phylogenetic tree, and inbreeding events in our samples. In buffalos from Germany, a mixed genetic make-up with contributions from Bulgaria (Murrah breed), Romania, and Italy was found. All in all, a high degree of genetic diversity was identified in European buffalos, and a novel genotype was described in Hungarian buffalos by this study. We demonstrate that European buffalos stand out from other buffalo populations worldwide, supporting the idea that buffalos have not completely disappeared from the European continent during the late Pleistocene. The high genetic diversity in European buffalos seems to be an excellent prerequisite for the establishment of local breeds characterized by unique traits and features. This study may also be considered as an initial step on the way to genome characterization for the sustainable development of the buffalo economy in Germany and other parts of Europe in the future.
Keywords: Bubalus bubalis; European populations; genetic diversity; genotyping; population structure; run of homozygosity.
Copyright © 2021 Noce, Qanbari, González-Prendes, Brenmoehl, Luigi-Sierra, Theerkorn, Fiege, Pilz, Bota, Vidu, Horwath, Haraszthy, Penchev, Ilieva, Peeva, Lüpcke, Krawczynski, Wimmers, Thiele and Hoeflich.
Conflict of interest statement
M-AF, MiT, HP, and RK are employed by the companies Gut Darss GmbH & Co., Hof am Meer GmBH, Wiesenburger Land eG, and Energiequelle GmbH, respectively. The remaining authors declare that the research was conducted in the absence of any commercial or financial relationships that could be construed as a potential conflict of interest.
Figures
FIGURE 1
Geographic map showing the locations with specific coordinates the buffalo samples were collected from, genotyped in the current study. The number of samples for each location are reported in Table 1.
FIGURE 2
Methodical workflow chart summarizing the analysis pipeline followed in the current study. QCF = Quality control filters (MAF < 0.05, -geno 0.01, -mind 0.01).
FIGURE 3
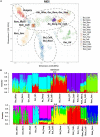
(A) Multi-Dimensional Scaling (MDS) plot based on genome-wide identity-by-state pairwise inferred with PLINK V1.7, including 36.014 SNPs from 477 individuals. This plot shows the genetic distance between all the 22 populations analyzed worldwide and published in part (Colli et al., 2018a; Deng et al., 2019a). The percentage of variances captured for each dimension is reported in brackets. The dashed circles mark the populations that cluster together. (B) Admixture analysis results at K = 4 and 6, including 22 buffalo populations worldwide. K values indicate the number of ancestries estimation (clusters), K = 6 was the best fitting solution for the lowest cross-validation error reported (CV = 0.61856). Populations are divided by a vertical black line, and it is partitioned into K colored segments that represent the population’s estimated membership fractions in K clusters. The 22 populations are localized in Germany (Ger_Wies, Wiesenburg, n = 28: Ger_Born, Born, n = 28; Ger_Stad, Stadland, n = 26; Ger_Jüt, Jüterbog, n = 27), Italy (Ita_Deng according to Deng et al., 2019a, n = 35; Ita_Colli according to Colli et al., 2018a, n = 15), Mozambique (Mozamb according to Colli et al., 2018a, n = 7), Bulgaria (Bul_Colli according to Colli et al., 2018a, n = 11), Bulgaria (Bul_Noce, n = 58), Hungary (Hun_HT, Földes, n = 19; Hun_Csak, Csákvar, n = 17; Hun_Tisz, Tiszataj, n = 19), Romania (Rom_Colli according to Colli et al., 2018a, n = 9; Rom_Mera, Mera, n = 16; Rom_Serc, Sercaia, n = 47), and also according to Colli et al., 2018a: Brazil (n = 15), Colombia (n = 12), Egypt (n = 15), Turkey (n = 15), Iran (n = 27), India (n = 5), and Pakistan (n = 28). Population labels and the number of individuals of both analyses are reported in Tables 1, 2.
FIGURE 4
(A) Multidimensional scaling (MDS) plot based on European buffalo populations available in this work. The dashed circles mark the populations that cluster together. (B) Admixture analysis results at K = 4 and 6 exclusively in European buffalo populations. K = 6 was the best fitting solution for the lowest cross-validation error reported (CV = 0.59712). Abbreviations and sample numbers are specified in Figure 3.
FIGURE 5
Phylogenetic tree indicating the genetic distance of 22 buffalo populations, analyzed and published in part (Colli et al., 2018a; Deng et al., 2019a), with worldwide distributions based on the fixation index (FST) matrix obtained from 36,014 SNPs in 477 individuals using Arlequine software. Abbreviations and sample numbers are specified in Figure 3.
FIGURE 6
The mean sum of runs of homozygosity (ROH) per population within each ROH length category in samples collected from buffalos in Bulgaria (Bul_Noce), Romania (Rom_Mera, Rom_Serc), Hungary (Hun_Csak, Hun_Tisz, Hun_HT), and Germany (Ger_Born, Ger_Jüt, Ger_Stad, Ger_Wies). Data include 61,813 SNPs genotyped in 285 samples (Mb: megabase); all other abbreviations and sample numbers are specified in Figure 3.
FIGURE 7
Violin Plot reporting the proportion of autosome covered in run of homozygosity (ROH) aka Genomic inbreeding coefficients (FROH) in Buffalo populations from Bulgaria (Bul_Noce), Romania (Rom_Mera, Rom_Serc), Hungary (Hun_Csak, Hun_Tisz, Hun_HT), and Germany (Ger_Born, Ger_Jüt, Ger_Stad, Ger_Wies). The black line indicates the median of FROH within the breed. Abbreviations and sample numbers are specified in Figure 3.
FIGURE 8
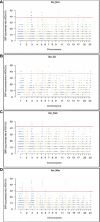
Genomic distribution of ROH islands in German buffalo samples. The x-axis represents the SNP genomic coordinate chromosome-wise, and the y-axis visualizes the frequency (%) of overlapping ROH shared among individuals. The red line indicates the threshold to define the regions containing the top 1% of most common ROH-associated SNPs (ROH hotspots or ROH islands). Populations are presented as (A) Mecklenburg-Western Pomerania (Ger_Born), (B) Brandenburg (Ger_Jüt), (C) Lower Saxony (Ger_Stad), and (D) Saxony (Ger_Wies). Abbreviations and sample numbers are specified in Figure 3.
FIGURE 9
Venn diagram reporting the number of common and unique genes present in overlapping ROH regions with the highest frequency SNPs in different buffalo populations from Germany (gene names are referred by Table 6).
FIGURE 10
Classification of genes with hotspot SNPs in ROH genome regions. Populations are presented as (A) Mecklenburg-Western Pomerania (Ger_Born), (B) Brandenburg (Ger_Jüt), (C) Lower Saxony (Ger_Stad), (D) Saxony (Ger_Wies). Abbreviations and sample numbers are specified in Figure 3.
Similar articles
- Morphometric and microsatellite-based comparative genetic diversity analysis in Bubalus bubalis from North India.
Vohra V, Singh NP, Chhotaray S, Raina VS, Chopra A, Kataria RS. Vohra V, et al. PeerJ. 2021 Aug 11;9:e11846. doi: 10.7717/peerj.11846. eCollection 2021. PeerJ. 2021. PMID: 34447621 Free PMC article. - Genetic relationship and diversity analysis of Indian water buffalo (Bubalus bubalis).
Vijh RK, Tantia MS, Mishra B, Bharani Kumar ST. Vijh RK, et al. J Anim Sci. 2008 Jul;86(7):1495-502. doi: 10.2527/jas.2007-0321. Epub 2008 Mar 14. J Anim Sci. 2008. PMID: 18344309 - New Insights on Water Buffalo Genomic Diversity and Post-Domestication Migration Routes From Medium Density SNP Chip Data.
Colli L, Milanesi M, Vajana E, Iamartino D, Bomba L, Puglisi F, Del Corvo M, Nicolazzi EL, Ahmed SSE, Herrera JRV, Cruz L, Zhang S, Liang A, Hua G, Yang L, Hao X, Zuo F, Lai SJ, Wang S, Liu R, Gong Y, Mokhber M, Mao Y, Guan F, Vlaic A, Vlaic B, Ramunno L, Cosenza G, Ahmad A, Soysal I, Ünal EÖ, Ketudat-Cairns M, Garcia JF, Utsunomiya YT, Baruselli PS, Amaral MEJ, Parnpai R, Drummond MG, Galbusera P, Burton J, Hoal E, Yusnizar Y, Sumantri C, Moioli B, Valentini A, Stella A, Williams JL, Ajmone-Marsan P. Colli L, et al. Front Genet. 2018 Mar 2;9:53. doi: 10.3389/fgene.2018.00053. eCollection 2018. Front Genet. 2018. PMID: 29552025 Free PMC article. - Asian water buffalo: domestication, history and genetics.
Zhang Y, Colli L, Barker JSF. Zhang Y, et al. Anim Genet. 2020 Mar;51(2):177-191. doi: 10.1111/age.12911. Epub 2020 Jan 22. Anim Genet. 2020. PMID: 31967365 Review. - Bubalus bubalis: A Short Story.
Minervino AHH, Zava M, Vecchio D, Borghese A. Minervino AHH, et al. Front Vet Sci. 2020 Dec 1;7:570413. doi: 10.3389/fvets.2020.570413. eCollection 2020. Front Vet Sci. 2020. PMID: 33335917 Free PMC article. Review.
Cited by
- Buffalo Milk as a Source of Probiotic Functional Products.
Vargas-Ramella M, Pateiro M, Maggiolino A, Faccia M, Franco D, De Palo P, Lorenzo JM. Vargas-Ramella M, et al. Microorganisms. 2021 Nov 5;9(11):2303. doi: 10.3390/microorganisms9112303. Microorganisms. 2021. PMID: 34835429 Free PMC article. Review. - Integrative QTL mapping and selection signatures in Groningen White Headed cattle inferred from whole-genome sequences.
Gonzalez-Prendes R, Ginja C, Kantanen J, Ghanem N, Kugonza DR, Makgahlela ML, Groenen MAM, Crooijmans RPMA. Gonzalez-Prendes R, et al. PLoS One. 2022 Oct 26;17(10):e0276309. doi: 10.1371/journal.pone.0276309. eCollection 2022. PLoS One. 2022. PMID: 36288367 Free PMC article. - New insights into semen separation techniques in buffaloes.
Andrei CR, Posastiuc FP, Constantin NT, Mitrea IL. Andrei CR, et al. Front Vet Sci. 2024 Jan 10;10:1347482. doi: 10.3389/fvets.2023.1347482. eCollection 2023. Front Vet Sci. 2024. PMID: 38269362 Free PMC article. Review. - Comparison of colostrum and milk extracellular vesicles small RNA cargo in water buffalo.
Mecocci S, Pietrucci D, Milanesi M, Capomaccio S, Pascucci L, Evangelista C, Basiricò L, Bernabucci U, Chillemi G, Cappelli K. Mecocci S, et al. Sci Rep. 2024 Aug 3;14(1):17991. doi: 10.1038/s41598-024-67249-6. Sci Rep. 2024. PMID: 39097641 Free PMC article. - Genetic Diversity Relationship in Azakheli Buffalo Inferred from mtDNA and MC1R Sequences Comparison.
Ali S, Nabi F, Awais M, Fareed SK, Hussain J, Adeola AC, Khan R, Ahmed N, Quan G. Ali S, et al. Biomed Res Int. 2022 Dec 13;2022:5770562. doi: 10.1155/2022/5770562. eCollection 2022. Biomed Res Int. 2022. PMID: 36601617 Free PMC article.
References
- Abd El-Salam M. H, El-Shibiny S. (2011). A comprehensive review on the composition and propertiesof buffalo milk. Dairy Sci. Technol. 91 663–699. 10.1007/s13594-011-0029-2 - DOI
- Alexiev A. (1998). The Water Buffalo. Bulgaria: St. Kliment Ohridski University Press.
- Bartosiewicz L. (1999). “The emergence of holocene faunas in the carpathian basin: a review,” in The Holocene History of the European Vertebrate Fauna, Ed. Benecke N., (Rahden: Modern Aspects of Research; ) 6 73–90.
- Biscarini F., Cozzi P., Gaspa G., Marras G. (2018). detectRUNS: Detect Runs of Homozygosity and Runs of Heterozygosity in Diploid Genomes. Available at: http://orca.cf.ac.uk/id/eprint/108906 (accessed March 16, 2020).
LinkOut - more resources
Full Text Sources
Other Literature Sources


