Exon junction complex dependent mRNA localization is linked to centrosome organization during ciliogenesis - PubMed (original) (raw)
Exon junction complex dependent mRNA localization is linked to centrosome organization during ciliogenesis
Oh Sung Kwon et al. Nat Commun. 2021.
Abstract
Exon junction complexes (EJCs) mark untranslated spliced mRNAs and are crucial for the mRNA lifecycle. An imbalance in EJC dosage alters mouse neural stem cell (mNSC) division and is linked to human neurodevelopmental disorders. In quiescent mNSC and immortalized human retinal pigment epithelial (RPE1) cells, centrioles form a basal body for ciliogenesis. Here, we report that EJCs accumulate at basal bodies of mNSC or RPE1 cells and decline when these cells differentiate or resume growth. A high-throughput smFISH screen identifies two transcripts accumulating at centrosomes in quiescent cells, NIN and BICD2. In contrast to BICD2, the localization of NIN transcripts is EJC-dependent. NIN mRNA encodes a core component of centrosomes required for microtubule nucleation and anchoring. We find that EJC down-regulation impairs both pericentriolar material organization and ciliogenesis. An EJC-dependent mRNA trafficking towards centrosome and basal bodies might contribute to proper mNSC division and brain development.
Conflict of interest statement
The authors declare no competing interests.
Figures
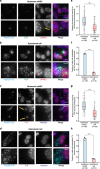
Fig. 1. EJC core components, eIF4A3 and Y14, strongly localize around centrosomes in quiescent mNSC, but not in differentiated ependymal cells.
Quiescent mNSC (mouse neural stem cell; a, c) and multiciliated ependymal cells (b, d) were stained for eIF4A3 (a, b) or Y14 (c, d). Centrosomes were labeled by FOP antibody. Primary cilia and centriole were stained by poly-glutamylated tubulin (PolyGlu-Tub) antibody. Nuclei were stained by Hoechst. Images result from maximum intensity projections of 12 z-stacks acquired at every 0.5 μm. Lower panels show enlarged images that are marked by white dashed square in the upper panel. Scale bars in the upper and lower panels are 5 and 3 μm, respectively (a–d). Yellow arrows depict concentrated EJC proteins (a, c). Fluorescence intensities for eIF4A3 (e) and for Y14 (h) were quantified in 2 μm circles around centrosomes and plotted as fluorescence intensities relative to the average fluorescence intensity in quiescent mNSC (set as 1.0). The red lines mark the median values and values between the 25th lower percentile and 75th higher percentile are in the box. Whiskers above and below the box correspond to 0.35th lower percentile and 99.65th higher percentile, respectively (e, g). The fraction of cells with detectable centrosomal eIF4A3 (f) or Y14 (h) was determined in either quiescent mNSC or ependymal cells. Data are presented by mean + SD of three independent experiments (f, h). ****P ≤ 0.0001, two-tailed Mann–Whitney test (e, g) and two-tailed _t_-test (f, h). The number of cells analyzed in three independent experiments is provided (e–h). Source data are provided as a Source Data file.
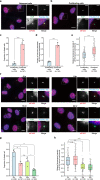
Fig. 2. EJC core component accumulates around centrosomes in quiescent RPE1 cells and decreases upon cell cycle re-entry.
Proliferating (a) and quiescent (b) RPE1 cells and RPE1 cells incubated with 10% serum containing media during indicated times after quiescence (f) were stained for eIF4A3. Centrosomes were labeled by FOP antibody and primary cilia, and centriole were stained by poly-glutamylated tubulin (PolyGlu-Tub) antibody. Nuclei were stained by Hoechst. Right panels show enlarged images of the white dashed square in the left panel. Scale bars in the left panels are 10 μm, and scale bars in right panels are 3 μm (a, b, f). The proportion of ciliated cells was determined in either proliferating or quiescent cell populations (c) and the cell populations incubated with serum containing media during indicated incubation times (g). The fraction of cells with detectable eIF4A3 (d) was determined in either proliferating or quiescent RPE1 cells. Column graphs present mean + SD of three independent experiments (c, d, g). Quantifications of eIF4A3 fluorescence intensities (e, h) were performed as described in the legend of Fig. 1 except that average fluorescence intensities of eIF4A3 in proliferating cells (e) and cells with 0 h incubation (h) are set to 1.0. The red lines mark the median values and values between the 25th lower percentile and 75th higher percentile are in the box. Whiskers above and below the box correspond to 0.35th lower percentile and 99.65th higher percentile, respectively (e, h). n.s. P > 0.05, *P ≤ 0.05, **P ≤ 0.01, ***P ≤ 0.001, and ****P ≤ 0.0001, two-tailed Mann–Whitney test (e, h) and two-tailed _t_-test (c, d, g). The number of cells analyzed in three independent experiments is provided (c–e, g, h). Source data are provided as a Source Data file.
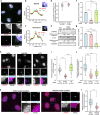
Fig. 3. Assembled ECJs on RNA accumulate around centrosomes.
Quiescent RPE1 cells were immunolabeled by eIF4A3 and Y14 (a). Quiescent cells transfected with indicated siRNAs (h) and permeabilized quiescent cells incubated with RNAse A or not (k) were stained for eIF4A3. poly-glutamylated tubulin (PolyGlu-Tub) antibody stains primary cilia and centrioles (a, h, k) and FOP antibody labels centrosomes (h, k). Nuclei were stained by Hoechst. Lower (a, h) or right panels (k) show enlarged images of the white dashed square in upper (a, h) or left panel (k). b and c are enlarged images from red and yellow dashed squares in lower panel (a). Scale bars in upper (a, h) or left (k) panels and lower (a, h) or right panels (k) panels are 10 and 3 μm, respectively. Relative fluorescence intensity of eIF4A3 and Y14 along the lines were plotted (b, c). Average fluorescence intensity on the line is set to 1.0. Colocalization of eIF4A3 and Y14 was analyzed in 2 μm circles around centrosomes and nuclear speckles and plotted (d, perfect colocalization is set to 1.0). siRNAs were validated by either Western blotting or RT-qPCR. Relative protein (e) or RNA level (f, g) normalized by GAPDH is depicted (average values of siCtrl is set to 1.0). Relative fluorescence intensities of eIF4A3 in the nucleus (i) and those around centrosome (j, l) were measured as described in Fig. 1 legend [the average fluorescence intensity of eIF4A3 in siCtrl (i, j) or buffer (l) condition is set to 1.0]. Columns and bars depict mean ± SD of three independent experiments (f, g). Boxes represent values between the 25th lower and 75th higher percentile, and the red lines mark the median. Whiskers above and below correspond to 0.35th lower and 99.65th higher percentile, respectively (d, i, j, l). n.s P > 0.05, *P ≤ 0.05, ***P ≤ 0.001, and ****P ≤ 0.0001, two tailed Mann–Whitney test (d, i, j, l) and two-tailed t-test (f, g). The number of cells analyzed in three independent experiments is provided (d, i, j, l). Source data are available in a Source Data file.
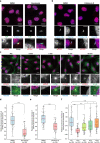
Fig. 4. An active microtubule-dependent transport is required to maintain EJC localization around centrosomes.
eIF4A3 antibody-stained quiescent RPE1 cells treated with either DMSO or Nocodazole (a), either DMSO or CiliobrevinD (b), and chilled quiescent cells subjected to a microtubule regrowth assay (c). Centrosomes were labeled by FOP antibody and primary cilia and centriole were stained by poly-glutamylated tubulin (PolyGlu-Tub) antibody (a, b). Microtubules were stained by ß-tubulin (ß-tub in figure) antibody (c). Nuclei were stained by Hoechst. Lower panels show enlarged images marked by white dashed square in the upper panel. Scale bars in the upper and lower panels are 10 and 3 μm, respectively. Quantification of fluorescence intensities of eIF4A3 (d–f) were performed as described in the legend of Fig. 1. The average fluorescence intensities for eIF4A3 in DMSO treated cells (d, e) or in pre-incubated quiescent cells (f) are set to 1.0. Boxes represent values between the 25th lower and 75th higher percentile, and the red lines mark the median. Whiskers above and below correspond to 0.35th lower and 99.65th higher percentile, respectively. n.s. P > 0.05, *P ≤ 0.05, and ****P ≤ 0.0001, two tailed Mann–Whitney test. The number of cells analyzed in three independent experiments is provided (d–f). Pre designates pre-incubation. Source data are provided as a Source Data file.
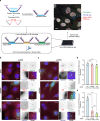
Fig. 5. EJC is required for centrosomal localization of NIN mRNA.
Summary of the high-throughput smiFISH pipeline (a). Top left: primary RNA probes contain a hybridization sequence that is complementary to the target mRNA flanked by two overhangs named Flap X and Y. Each Flap was annealed to a locked nucleic acid (LNA) oligo labeled with two TYE 563 molecules in a pre-hybridization step. Bottom: Duplexes were then hybridized to the mRNA of interest followed by immunofluorescence against Arl13b to label primary cilia in 96-well plates. Plates were finally imaged with a spinning disk confocal microscope. Top right: A micrograph showing a typical field of view from the screen. Red dots correspond to a single mRNA molecule. Scale bar represents 10 μm. Quiescent RPE1 cells stably expressing centrin1-GFP were stained by probes against BICD2 mRNA (b) or NIN mRNA (c) after knock-down of either eIF4A3 or Y14. Nuclei were stained by Hoechst. Images are resulted from maximum intensity projections of 14 z-stacks acquired at every 0.5 μm. Right panels show enlarged images of the white dashed square in the left panels. Scale bars in the left panels are 10 μm, and scale bars in right panels are 3 μm (b, c). Proportion of cells displaying centrosomal BICD2 (d) or NIN (e) RNA pattern was depicted. Columns and bars depict mean ± SD of three independent experiments. n.s P > 0.05, **P ≤ 0.01, and ***P ≤ 0.001, two-tailed _t_-test. The number of cells analyzed in three independent experiments is provided (d, e). Source data are provided as a Source Data file.
Fig. 6. Knock-down of EJC components impairs centrosome structure and primary cilia formation.
Quiescent RPE1 cells transfected with siRNAs against eIF4A3 or Y14 were stained for NIN (a) or PCM1 (centriolar satellite protein), FOP, and poly-glutamylated tubulin (PolyGlu-Tub; c). Nuclei were stained by Hoechst. Lower panels are enlarged images marked by white dashed square in the upper panels. Scale bars in the upper and lower panels are 10 and 3 μm, respectively (a, c). Images were processed by maximum intensity projections of 15 z-stacks acquired at every 0.5 μm (a). Quantification of fluorescence intensities of NIN were performed as described in the legend of Fig. 1. Boxes represent values between the 25th lower and 75th higher percentile, and the red lines mark the median. Whiskers above and below correspond to 0.35th lower and 99.65th higher percentile, respectively. The average fluorescence intensity of NIN in Ctrl siRNA treated cells is set to 1.0 (b). Proportion of cells with ectopic centriolar satellite with FOP upon the siRNA treatments indicated (d). Proportion of ciliated cells upon the indicated siRNA treatments (e). Columns and bars depict mean ± SD of three independent experiments (d, e). n.s. P > 0.05, *P ≤ 0.05, **P ≤ 0.01, ***P ≤ 0.001, and ****P ≤ 0.0001, two-tailed Mann–Whitney test (b) and two-tailed _t_-test (d, e). The number of cells analyzed in three independent experiments is provided (b, d, e). Source data are provided as a Source Data file.
Fig. 7. Multiple pathways for RNA localization toward centrosome.
During quiescence, mother centriole tightly attaches to plasma membrane by distal appendages to nucleate the formation of primary cilia. To relay the signals from environment, several receptors are embedded at ciliary membrane. Centriolar satellites deliver components of centrosome and primary cilia. Centrosomal transcripts could be localized by ① EJC and/or other RNPs-mediated pathway, ② polysome-dependent pathway, and ③ polysome-dependent and EJC-dependent pathway.
Similar articles
- Casein kinase 1δ functions at the centrosome and Golgi to promote ciliogenesis.
Greer YE, Westlake CJ, Gao B, Bharti K, Shiba Y, Xavier CP, Pazour GJ, Yang Y, Rubin JS. Greer YE, et al. Mol Biol Cell. 2014 May;25(10):1629-40. doi: 10.1091/mbc.E13-10-0598. Epub 2014 Mar 19. Mol Biol Cell. 2014. PMID: 24648492 Free PMC article. - CWC22-dependent pre-mRNA splicing and eIF4A3 binding enables global deposition of exon junction complexes.
Steckelberg AL, Altmueller J, Dieterich C, Gehring NH. Steckelberg AL, et al. Nucleic Acids Res. 2015 May 19;43(9):4687-700. doi: 10.1093/nar/gkv320. Epub 2015 Apr 13. Nucleic Acids Res. 2015. PMID: 25870412 Free PMC article. - A role for Gle1, a regulator of DEAD-box RNA helicases, at centrosomes and basal bodies.
Jao LE, Akef A, Wente SR. Jao LE, et al. Mol Biol Cell. 2017 Jan 1;28(1):120-127. doi: 10.1091/mbc.E16-09-0675. Epub 2016 Nov 9. Mol Biol Cell. 2017. PMID: 28035044 Free PMC article. - The Physiological Roles of the Exon Junction Complex in Development and Diseases.
Asthana S, Martin H, Rupkey J, Patel S, Yoon J, Keegan A, Mao Y. Asthana S, et al. Cells. 2022 Apr 1;11(7):1192. doi: 10.3390/cells11071192. Cells. 2022. PMID: 35406756 Free PMC article. Review. - Diverse Roles of the Exon Junction Complex Factors in the Cell Cycle, Cancer, and Neurodevelopmental Disorders-Potential for Therapeutic Targeting.
Martin H, Rupkey J, Asthana S, Yoon J, Patel S, Mott J, Pei Z, Mao Y. Martin H, et al. Int J Mol Sci. 2022 Sep 8;23(18):10375. doi: 10.3390/ijms231810375. Int J Mol Sci. 2022. PMID: 36142288 Free PMC article. Review.
Cited by
- Enzyme-mediated proximity labeling reveals the co-translational targeting of DLGAP5 mRNA to the centrosome during mitosis.
Wang G, Li M, Zou P. Wang G, et al. RSC Chem Biol. 2025 Mar 26;6(6):919-932. doi: 10.1039/d4cb00155a. eCollection 2025 Jun 4. RSC Chem Biol. 2025. PMID: 40248433 Free PMC article. - The exon junction complex is required for DMD gene splicing fidelity and myogenic differentiation.
Da Cunha D, Miro J, Van Goethem C, Notarnicola C, Hugon G, Carnac G, Cossée M, Koenig M, Tuffery-Giraud S. Da Cunha D, et al. Cell Mol Life Sci. 2024 Mar 21;81(1):150. doi: 10.1007/s00018-024-05188-1. Cell Mol Life Sci. 2024. PMID: 38512499 Free PMC article. - Exon-junction complex association with stalled ribosomes and slow translation-independent disassembly.
Bensaude O, Barbosa I, Morillo L, Dikstein R, Le Hir H. Bensaude O, et al. Nat Commun. 2024 May 17;15(1):4209. doi: 10.1038/s41467-024-48371-5. Nat Commun. 2024. PMID: 38760352 Free PMC article. - The Unkempt RNA binding protein reveals a local translation program in centriole overduplication.
Martinez A, Stemm-Wolf AJ, Sheridan RM, Taliaferro MJ, Pearson CG. Martinez A, et al. bioRxiv [Preprint]. 2024 Jul 30:2024.07.29.605660. doi: 10.1101/2024.07.29.605660. bioRxiv. 2024. PMID: 39131325 Free PMC article. Preprint. - p53 Activation in Genetic Disorders: Different Routes to the Same Destination.
Tsai YY, Su CH, Tarn WY. Tsai YY, et al. Int J Mol Sci. 2021 Aug 27;22(17):9307. doi: 10.3390/ijms22179307. Int J Mol Sci. 2021. PMID: 34502215 Free PMC article. Review.
References
- Kwon SC, et al. The RNA-binding protein repertoire of embryonic stem cells. Nat. Struct. Mol. Biol. 2013;20:1122–1130. - PubMed
- Castello A, et al. Insights into RNA biology from an atlas of mammalian mRNA-binding proteins. Cell. 2012;149:1393–1406. - PubMed
- Baltz AG, et al. The mRNA-bound proteome and its global occupancy profile on protein-coding transcripts. Mol. Cell. 2012;46:674–690. - PubMed
- Gehring NH, Wahle E, Fischer U. Deciphering the mRNP code: RNA-bound determinants of post-transcriptional gene regulation. Trends Biochem. Sci. 2017;42:369–382. - PubMed
Publication types
MeSH terms
Substances
LinkOut - more resources
Full Text Sources
Other Literature Sources
Molecular Biology Databases
