Wheat Pm4 resistance to powdery mildew is controlled by alternative splice variants encoding chimeric proteins - PubMed (original) (raw)
doi: 10.1038/s41477-021-00869-2. Epub 2021 Mar 11.
Victoria Widrig 2, Gerhard Herren 2, Thomas Wicker 2, Helen Zbinden 2, Julien Gronnier 2, Laurin Spörri 2 3, Coraline R Praz 2 4, Matthias Heuberger 2, Markus C Kolodziej 2, Jonatan Isaksson 2, Burkhard Steuernagel 5, Miroslava Karafiátová 6, Jaroslav Doležel 6, Cyril Zipfel 2 7, Beat Keller 8
Affiliations
- PMID: 33707738
- PMCID: PMC7610370
- DOI: 10.1038/s41477-021-00869-2
Wheat Pm4 resistance to powdery mildew is controlled by alternative splice variants encoding chimeric proteins
Javier Sánchez-Martín et al. Nat Plants. 2021 Mar.
Erratum in
- Author Correction: Wheat Pm4 resistance to powdery mildew is controlled by alternative splice variants encoding chimeric proteins.
Sánchez-Martín J, Widrig V, Herren G, Wicker T, Zbinden H, Gronnier J, Spörri L, Praz CR, Heuberger M, Kolodziej MC, Isaksson J, Steuernagel B, Karafiátová M, Doležel J, Zipfel C, Keller B. Sánchez-Martín J, et al. Nat Plants. 2023 Mar;9(3):502-503. doi: 10.1038/s41477-023-01375-3. Nat Plants. 2023. PMID: 36869130 No abstract available.
Abstract
Crop breeding for resistance to pathogens largely relies on genes encoding receptors that confer race-specific immunity. Here, we report the identification of the wheat Pm4 race-specific resistance gene to powdery mildew. Pm4 encodes a putative chimeric protein of a serine/threonine kinase and multiple C2 domains and transmembrane regions, a unique domain architecture among known resistance proteins. Pm4 undergoes constitutive alternative splicing, generating two isoforms with different protein domain topologies that are both essential for resistance function. Both isoforms interact and localize to the endoplasmatic reticulum when co-expressed. Pm4 reveals additional diversity of immune receptor architecture to be explored for breeding and suggests an endoplasmatic reticulum-based molecular mechanism of Pm4-mediated race-specific resistance.
Conflict of interest statement
Competing Interests statement
The authors declare no competing interests.
Figures
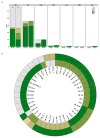
Extended Data Fig. 1. Pm4a and Pm4b convey resistance to a wide range of Bgt isolates
a, Disease reactions of Fed-Pm4a and Fed-Pm4b NILs to 108 genetically diverse contemporary Bgt isolates,,. b, Selection of Bgt isolates for which Fed-Pm4a and Fed-Pm4b NILs showed a differential resistance/susceptibility pattern. The outer and inner circle represent the reaction pattern of Fed-Pm4a and Fed-Pm4b, respectively. Disease reaction was evaluated seven days post-inoculation. Five classes of host reactions were distinguished: R = resistance (0-10% of leaf area covered), IR (10-25% of leaf area covered), I (25-50% of leaf area covered), IS (50-75 % of leaf area covered) and S (>75% of leaf area covered). CHN: China, ISR: Israel; CHE; Switzerland; FRA: France; USA: United States; GRB: Great Britain; JPN; Japan.
Extended Data Fig. 2. Expression profiling of Pm4b mutants following infection with Bgt96224
Transcripts levels of the Pm4_V1 and Pm4_V2 splice variants in mock-inoculated or _Bgt_-inoculated Fed-Pm4b plants. Statistical analysis was done using a two-tailed t-test at p < .05 (mock vs infected) based on n = 4 biological replicates. Error bars, mean ± s.e.m. Exact P values are shown above bars
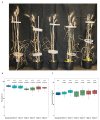
Extended Data Fig. 3. Agronomically-related traits of selected T2 transgenic families overexpressing Pm4b_V1CDS and Pm4b_V2CDS transgenes
a, Plant growth of representative T2 transgenics from families T2#52-1.4 and T2#52-3.11 compared to Bobwhite S26 in the following order: Bobwhite S26, T2#52-1.4_1.10, T2#52-1.4_1.9, T2#52-3.11_1.2 and T2#52-3.11_1.3 b, Plant height of the T2 families overexpressing Pm4b_V1CDS and Pm4b_V2CDS transgenes presented in Fig 3c and Supplementary Table 3. Names are indicated in the x-axis. c, Thousand Grain Weight for the same T2 families. Selected representative of the same T2 family are displayed with the same color: T2#3 in cyan, T2#25 lime green and T2#52 in magenta. In the boxplots, center lines show the medians; box limits indicate the 25th and 75th percentiles as determined by the geom_boxplot function of the ggplot2 R package; whiskers extend 1.5 times the interquartile range from the 25th and 75th percentiles, individual data points are represented by dots. On top of each boxplot, p values based on two-tailed _t_-test at p < .05 (transformants versus Bobwhite S26). Above p values, n = the number of T2 progeny.
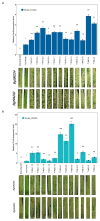
Extended Data Fig. 4. Gene expression in transgenic wheat plants overexpressing single splice variants of the Pm4b gene.
a, Expression levels of Pm4bV1_CDS transgenes in selected T1 progeny for three independent transgenic events (T1#9, T1#12, T1#12) overexpressing full-length cDNA of Pm4b_V1 compared to the endogenous Pm4b_V1 transcripts in the wild-type Fed-Pm4b (second bar). b, Expression levels of Pm4bV2_CDS transgenes in selected T1 progeny for three independent transgenic events (T1#6, T1#24, T1#29) overexpressing full-length cDNA of Pm4b_V2 compared to the endogenous Pm4b_V2 transcripts in the wild-type Fed-Pm4b (second bar). For a and b, data points are technical replicates (triple quantifications) on single T1 progenies. Error bars, mean ± s.e.m. of three technical replicates. On top of each bar, the number corresponds to the x-fold expression compared to Pm4b_V1 or Pm4b_V2 in the wild-type Fed-Pm4 genotype. Below each T1 progeny, representative images of disease reactions after infection with the Pm4a/_b_-avirulent Bgt96224 and Bgt94202 isolates are shown.
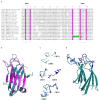
Extended Data Fig. 5. Predicted Pm4 kinase catalytic domain
A multiple amino acid sequence alignment of 38 protein kinase catalytic domains involved in disease resistance was used to infer the Pm4b kinase domain architecture. In Pm4b (indicated with a red rectangle) all the 14 key conserved residues of protein kinases are present. In the alignment, red arrowheads mark invariant residues (G52, K72, E91, D166, N171, D184, G186, E208, R280), which are numbered with upper case numbers corresponding to their position in the α form of the cAMP-dependent protein kinase catalytic unit (cAPK). Likewise, black arrowheads indicate the mostly invariant residues (G50, V57, F185, D220, G225). Based on the presence of a L residue at position R165 of cAPK in subdomain VI, Pm4 Kinase was classified as a non-RD kinase. Moreover, conserved residues in subdomain VI (D166 -> N171, DLKPAN in Pm4b vs. DLPKPEN in cAPK) and VIII (GTMGYLAPE in Pm4b vs. GT/SXXY/FXAPE in cAPK) indicate that the Pm4 kinase domain is a serine/threonine protein kinase. Labels: red and black arrowheads, key invariant and nearly invariant residues in the protein kinase catalytic domains, respectively. Light blue diamond points to the RD or non-RD kinase determination site. Black asterisks, substrate binding site. Green arrowheads, ATP binding site. Core conserved, diagnostic regions of subdomains I, II, VI, and VIII are highlighted by grey bars labelled with Roman numerals. On top of the wrapped alignment, EMS mutagenized line designations affecting the Pm4 kin domain in Pm4a or Pm4b genes and corresponding amino acid changes are indicated. Violet squares indicate polymorphic amino acids within the kinase domain among the Pm4 allelic variants described in this study. Numbers above violet squares indicate the position on the alignment based on the cAPK sequence.
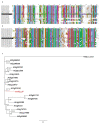
Extended Data Fig. 6. Sequence alignment of Pm4 C2 domains with homologous C2 domains of Arabidopsis MCTPs.
a, Sequence alignment of Pm4b-C2C with C2C domains from Arabidopsis MCTPs. b, likewise alignment of C2D domains. C2 domains were delimited based on Conserved Domain Database (CDD) from NCBI106. The location of the domain is indicated by the sequence range numbers. C2 domains in Pm4 (black background) are indicated with a red rectangle. c, Phylogenic tree of C2C and C2D domains of Arabidopsis MCTPs and Pm4b-C2C/C2D domains. The human DySF dysferlin C2C/D domains was used as outgroup.
Extended Data Fig. 7. Determination of aspartate residues predicted to be involved in Ca2+-binding in Pm4b C2 domains.
a, Sequence alignment of Pm4b-C2C and Pm4b-C2D domains with C2 domains previously described to bind Ca2+. UniProt entry names followed by the specific C2 domain displayed are located on the left. The region of the C2 domain displayed is indicated by the sequence range numbers. Conserved aspartate residues involved in Ca2+-binding are highlighted in pink. Pm4b_C2C (fourth row from the bottom) does not have conserved aspartate residues and exhibits diverse amino acid substitutions, including D -> E, A or I. However, Pm4b_CD2 (third row from the bottom) has three conserved aspartate residues (positions I, III and IV) and two conservative substitutions, asparagine (position II) and glutamine (position V), both polar and relatively small amino acids. Interestingly, Pm4_C2D contains an insertion of eight amino acids (green) just before the predicted Ca2+ binding region 3 that shifts the position of the conserved aspartate residues at position III and IV (highlighted in red) (see Extended Data Fig. 6). Rectangles denote calcium-binding regions (CBR) 1 and 3, respectively. b, Structured-based alignment of C2D Pm4b_V2 (turquoise) and the C2 domain from PKCα (pink) (Protein kinase C alpha type, PDB: 1DSY). The predicted structural model of the Pm4bC2 domain was done using the Phyre2 server on the basis of the crystal structure of rat otoferlin c2a (PDB: 3L9B, Fold library id: c3l9bA) with 14% of identity and 99.9% of confidence. c, On top, calcium binding regions (CBR) CBR1 and 3 of PKCα. In the middle, CBR1 and 3 of Pm4b_C2D domain. On the bottom part, overall alignment of CBRs 1 and 3 of Pm4b_C2D domain (turquoise) and PKCα (dark blue). d, Three-dimensional structure of C2D domain of Pm4b using the Phyre2120 server based on the crystal structure of rat otoferlin c2a (PDB: 3L9B, Fold library id: c3I9bA) with 14% of identity and 99.9 % of confidence highlighting in blue CBR 1 and 3, with predicted residues involved in Ca2+-binding labelled. Calcium ions are shown as grey balls.
Extended Data Fig. 8. Negative controls for the Pm4b interaction
a, Pm4b_V1 does not interact with the ER-marker ER_ck_CD3_95339. b, Pull-down with anti-HA beads is specific for the presence of HA-tagged Pm4b variants. Co-immunoprecipitation experiments were repeated two times with similar results.
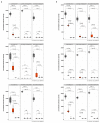
Extended Data Fig. 9. Binding ability of Pm4b variants for homo- and heteromeric interactions.
a, Split-LUC combinations showing luciferase signal for Pm4b_V1 homomeric interaction in Fig. 4e were co-infiltrated with fluorescence-tagged Pm4b_V2 protein variants. b, Split-LUC combinations showing luciferase signal for Pm4b_V2 homomeric interaction in Fig. 4f were co-infiltrated with fluorescence-tagged Pm4b_V1 protein variants. The data are displayed following the same logic as presented in Figure 4: in each of the 18 panels, the first boxplot corresponds to the positive control, AvrPm3b_N-LUC & AvrPm3b_C_LUC. The second boxplot (orange color) corresponds to the tested combination, displayed at the top of each panel. For simplicity, V1 and V2 refer to Pm4b_V1 and Pm4b_V2, respectively. Finally, the last two boxplots in each panel correspond to the negative controls co-infiltrated. Significant differences were determined by Krustal-Wallis test followed by Dunn’s multiple comparisons test with two-sided 95.0% confidence interval with Bonferroni correction based on n = 24 (8 technical and 3 biological replicates). Exact P values are shown above bars. In the boxplots, center lines show the medians; box limits indicate the 25th and 75th percentiles as determined by the geom_boxplot function of the ggplot2 R package; whiskers extend 1.5 times the interquartile range from the 25th and 75th percentiles, individual data points are represented by dots.
Extended Data Fig. 10. Bivariate flow karyotype GAA-FITC vs. DAPI obtained after the analysis of chromosomes isolated from mutant pm4b_m256
The population representing chromosome 2A, which was flow-sorted, is highlighted in orange. Inset: Flow-sorted chromosomes were identified microscopically after FISH with probes for GAA microsatellites (green) and Afa repeat (red). The fluorescent labeling pattern allowed chromosome identification and estimation of the contamination of sorted fractions by other chromosomes. Chromosomes were counterstained by DAPI (blue).
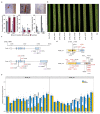
Fig. 1. Molecular identification and characterization of a Pm4b candidate gene.
a, host reactions of Fed-Pm4a, Fed-Pm4b, Fed_-Pm2_ and Fed challenged with Bgt96224 isolate at 2 and 6 dpi. Left, percentage of pre-penetration resistance arresting conidia growth without hypersensitive cell-death (HR). Middle, percentage of epidermal cells with haustorium associated with HR. Right, percentage of established colonies. Different letters indicate significant differences using ANOVA followed by Tukey honest significant difference (HSD) test (P<0.05). Scale bar, 50μm. b, Powdery mildew infection of seedlings from resistant Pm4b wheat cv. Fed-Pm4b, eight EMS-derived susceptible mutants and the susceptible control Federation. Scale bar, 1 cm c, Gene structure and alternative splicing of the Pm4b gene. Exons are indicated as blue boxes. Mutations identified by MutChromSeq are shown in red. In purple, mutants affected on exons six and seven subjected to expression analysis. Please note that m256 was subjected to flow-sorting and gene expression analysis. d, Pm4b_V1 and Pm4b_V2 protein isoforms with domains indicated by colours: yellow, serine-threonine kinase; light-blue, C2; gray, phosphoribosyltransferase C-terminal. Black and orange vertical lines indicate pm4a and pm4b EMS-derived mutants, respectively. Each mutation, letter after amino acid and its position in the wild-type, is only indicated in one of the two Pm4 isoforms. Asterisks denote early stop codons. Complete information can be found in Supplementary Table 2. Scale bars: 100 aa. e, Transcripts levels of the Pm4_V1 and Pm4_V2 splice variants in mock-inoculated or _Bgt_-inoculated Fed-Pm4b plants. Error bars denoting s.e.m. are based on four biological replicates. Statistical analysis was done using a two-tailed _t_-test at p < .05 (mock vs infected) based on n = 4 biological replicates. Exact p values are shown above bars.
Fig. 2. Confirmation of the functional identity of the Pm4b gene by transgenic complementation and VIGS.
a, Schematic diagram of the two constructs with the coding sequences (CDS) Pm4b_V1CDS and Pm4b_V2CDS, used for transformation of susceptible Bobwhite S26 (BW). Blue and green bars above the schematic diagrams of constructs indicate regions targeted for construct-specific PCR amplification using transgene specific primers displayed in Supplementary Table 7b, Screening of T1 progeny from T1 family Pm4bV1V2CDS-25. The presence (+) or absence (-) of the Pm4bV1_CDS (top row) and Pm4bV2_CDS (lower row) transgenes corresponded to the resistance/susceptibility phenotype for the individual tested T1 plants. c, Expression levels of Pm4bV1_CDS (blue) and Pm4bV2_CDS (turquoise) transgenes in selected T2 progenies compared to the endogenous Pm4b_V1 and Pm4b_V2 transcripts in the wild-type Fed-Pm4b (second bar). The data points are technical replicates (double quantifications) on single T2 progenies. On top of each bar, number corresponds to the x-fold expression compared to Pm4b_V1 or Pm4b_V2 in the wild-type Fed-Pm4b genotype. Below each T2 progeny, representative images of disease reactions after infection with the Pm4a/_b_-avirulent Bgt96224 isolate and with the Pm4a/_b_-virulent BgtJIW2 isolate are shown. d, Schematic diagram of Pm4b_V1 and Pm4b_V2 splicing variants, where blue and green bars indicate regions selected as VIGS targets. Black bars below the diagrams indicate regions targeted for qRT-PCR amplification using transcript-specific primers displayed in Supplementary Table 7. Symptoms of the third and fourth leaves of representative plants subjected to VIGS and after infection with the _Pm4b_-avirulent Bgt96224 isolate. e. Expression levels of the Pm4bV1 (light green bars) and Pm4bV2 splicing variants (turquoise bars) of BSMV:γ-, BSMV:Pm4b_V1- and BSMV:_Pm4b_V2-_infected Fed-Pm4b plants assessed by quantitative reverse-transcription PCR (qRT-PCR). Statistical analysis was done using a two-tailed _t_-test at p < .05 (BSMVg vs BSMV:Pm4V1 or BSMV:Pm4V2) based on n = 4-8 biological replicates, where black and grey dots represent the 3rd and 4th leaves, respectively. Error bars, mean ± s.e.m. Exact P values are shown above bars.
Fig. 3. The Pm4 protein variants differ in the S_TKc and transmembrane domains
a, Pm4 protein isoforms, Pm4_V1 (left) and Pm4_V2 (right), differ in few amino acid changes (red bars) among the six Pm4 alleles described. Protein domains are indicated by colours corresponding to the ones displayed in Fig. 1d. Scale bar, 100 amino acids. b, Protein sequence comparison of the Pm4 variants, where dots represent identical amino acids to Pm4a. c, Topological model of Pm4b_V2 modified from Protter displaying the two transmembrane domains. Below, sequence alignment of the second transmembrane domain of the Pm4a, b and g protein variants, indicating their start and the endpoints at protein level. Dots represent identical amino acids compared to Pm4a. d, Cartoon model of the core domain of the Pm4b S_TKc done using the Phyre2 server based on the crystal structure of human IKK1 (PDB: 5EBZ, Fold library id: c5ebzF) with 25% of identity and 100.0 % of confidence. In purple, the activation loop, in blue, the catalytic loop and in pink, the DFG motif. e, WebLogo graphical representation of sequence alignment for positions 126, 205 and 208 in Pm4 protein variants compared the kinase-containing resistance proteins described in Extended Data Fig. 5. Note that x-axis numbers correspond to numbers in the alignment of Extended Data Fig. 5. In position 121 (126 in Pm4), kinase-containing resistance proteins mostly have negatively charged amino acids while Pm4g has a Lysine, positively charged. In position 195 (205 in Pm4), Pm4a is the only one, together with BSK1, having a positively charged amino acid. Finally, in position 198 (208 in Pm4) mostly occupied by aliphatic amino acids, Pm4a shows a Tryptophan, which is unique among all the kinases. These amino acid changes might play a fundamental role in differentiating race-specificity among Pm4 protein variants. d, close-up of the catalytic and activation loops of Pm4b (top) and Pm4a (bottom) highlighting the occurring amino acid changes.
Fig. 4. Pm4_V1 and Pm4_V2 form an ER-associated complex.
a, Confocal micrographs depicting surface views of N. benthamiana epidermal cells co-expressing Pm4b_V1-eGFP with a marker of the cytosol, b, Pm4b_V2-eGFP with the marker of the endoplasmic reticulum and c, Pm4b_V2-eGFP with Pm4b_V1-TagRFP. Scale bar of 10 μm applies to all images. Localization experiments were repeated five times independently with similar results. d, Identification of potential Pm4b_V1 and Pm4b_V2 homo- and heterodimeric protein interactions via Co-IP. Pm4b_V2 was tagged N-terminally HA- and Flag-tagged. Pm4b_V1 was C-terminally with HA- and Flag-tagged. Representative results of HA pulldown experiments, top panel, where + sign states the presence of the protein. Proteins were detected using anti-HA and anti-Flag antibodies following SDS-PAGE and membrane transfer (bottom panel). First and second columns show homomer formations of Pm4b_V2 and Pm4b_V1, respectively and the third column heteromer formation between Pm4b_V2 and Pm4b_V1. Ponceau staining of the Western blot membrane is depicted at the bottom. Co-immunoprecipitation experiments were repeated three times with similar results. e, Split-luciferase complementation assays showing dimerization of Pm4b_V1 isoform, f, Pm4b_V2 isoform and g, interaction between Pm4b_V1 and Pm4b_V2 isoforms. At the top of each panel the tested combination is displayed, specifying if the N- or C-terminal part of LUC was cloned at the beginning or the end of the protein. For simplicity, V1 and V2 refer to Pm4b_V1 and Pm4b_V2, respectively. The first boxplot corresponds to the positive control, AvrPm3b-AvrPm3b. Second boxplot corresponds to the combination tested, specified at the top in each panel, and the last two to the negative controls used: each component of the test combination with the complementary N-LUC or C-LUC Pm17 tagged. In the boxplots, center lines show the medians; box limits indicate the 25th and 75th percentiles as determined by the geom_boxplot function of the ggplot2 R package; whiskers extend 1.5 times the interquartile range from the 25th and 75th percentiles, individual data points are represented by dots. Significant differences were determined by Krustal-Wallis test followed by Dunn’s multiple comparisons test with two-sided 95.0% confidence interval with Bonferroni correction based on n = 24 (8 technical and 3 biological replicates). Exact P values are shown above bars.
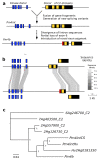
Fig. 5. Evolutionary origin of Pm4b.
a, Model for the evolution of Pm4b. A Kinase domain (blue) was fused to a fragment of a gene encoding a protein with four C2 domains (yellow). The product (Pm4int) encodes two alternative transcripts and comprises 7 exons. Subsequent duplication of Pm4int led to the rise of Pm4b which undergoes re-shuffling of intron 5, leading to loss of the CDS of one C2 domain and to the introduction of a unique sequence in exon 6 (red). b, Comparison of genomic regions of Pm4int (top) and Pm4b (bottom). The two alternative transcripts are depicted on different levels. Sequences that can be aligned at the DNA level are indicated with shaded areas, with sequence identify shown in different shades of grey. c, Phylogenetic tree of the CDS for the C2 domains. Distant homologs 7Ag403500 and 6Ag246700 were used to root the tree. Pm4int and Pm4b from wheat and barley cluster with the descendants of the proposed donor of the C2 domains.
Fig. 6. A possible working model of Pm4-mediated resistance.
a, A schematically drawn wheat epidermal cell attacked by a mature powdery mildew germling. An early release of small amounts of effectors at around 12 hours translates ① into induction of Pm4b-dependent pre-haustorial resistance ②. Later, when large amounts of effectors are present ③, the recognition of AvrPm4 (light blue) by Pm4b protein complex will lead to Pm4b-mediated hypersensitive response (HR) ④. ER, endoplasmic reticulum. b, Schematic model of a possible activation mechanism of Pm4 upon a hypothetical AvrPm4 recognition. In the absence of the AvrPm4, Pm4_V1 and Pm4_V2 are in a resting state, forming a heterocomplex interacting via C2 domains. This heterocomplex is anchored into the membrane of the ER and it is inactive (yellow star in the S_TKc domains). Upon AvrPm4 recognition by the C2C/D or the kinase domains the heterocomplex undergoes conformational changes, leading to activation of the kinase activity (red star in the S_TKc domains) and disease resistance. Numbers indicate the sequence of steps of the proposed model.
Similar articles
- The NB-LRR gene Pm60 confers powdery mildew resistance in wheat.
Zou S, Wang H, Li Y, Kong Z, Tang D. Zou S, et al. New Phytol. 2018 Apr;218(1):298-309. doi: 10.1111/nph.14964. Epub 2017 Dec 27. New Phytol. 2018. PMID: 29281751 - Identification of a Pm4 Allele as a Powdery Mildew Resistance Gene in Wheat Line Xiaomaomai.
Yao D, Ijaz W, Liu Y, Hu J, Peng W, Zhang B, Wen X, Wang J, Qiu D, Li H, Xiao S, Sun G. Yao D, et al. Int J Mol Sci. 2022 Jan 21;23(3):1194. doi: 10.3390/ijms23031194. Int J Mol Sci. 2022. PMID: 35163113 Free PMC article. - Two members of TaRLK family confer powdery mildew resistance in common wheat.
Chen T, Xiao J, Xu J, Wan W, Qin B, Cao A, Chen W, Xing L, Du C, Gao X, Zhang S, Zhang R, Shen W, Wang H, Wang X. Chen T, et al. BMC Plant Biol. 2016 Jan 25;16:27. doi: 10.1186/s12870-016-0713-8. BMC Plant Biol. 2016. PMID: 26810982 Free PMC article. - Serine/threonine kinase gene Stpk-V, a key member of powdery mildew resistance gene Pm21, confers powdery mildew resistance in wheat.
Cao A, Xing L, Wang X, Yang X, Wang W, Sun Y, Qian C, Ni J, Chen Y, Liu D, Wang X, Chen P. Cao A, et al. Proc Natl Acad Sci U S A. 2011 May 10;108(19):7727-32. doi: 10.1073/pnas.1016981108. Epub 2011 Apr 20. Proc Natl Acad Sci U S A. 2011. PMID: 21508323 Free PMC article. - Transcriptome analysis of genes related to resistance against powdery mildew in wheat-Thinopyrum alien addition disomic line germplasm SN6306.
Li Q, Niu Z, Bao Y, Tian Q, Wang H, Kong L, Feng D. Li Q, et al. Gene. 2016 Sep 15;590(1):5-17. doi: 10.1016/j.gene.2016.06.005. Epub 2016 Jun 2. Gene. 2016. PMID: 27265028 Review.
Cited by
- Identification of genetic loci for powdery mildew resistance in common wheat.
Liu X, Zhang X, Meng X, Liu P, Lei M, Jin H, Wang Y, Jin Y, Cui G, Mu Z, Liu J, Jia X. Liu X, et al. Front Plant Sci. 2024 Oct 9;15:1443239. doi: 10.3389/fpls.2024.1443239. eCollection 2024. Front Plant Sci. 2024. PMID: 39445142 Free PMC article. - Analysis of a global wheat panel reveals a highly diverse introgression landscape and provides evidence for inter-homoeologue chromosomal recombination.
Heuberger M, Bernasconi Z, Said M, Jung E, Herren G, Widrig V, Šimková H, Keller B, Sánchez-Martín J, Wicker T. Heuberger M, et al. Theor Appl Genet. 2024 Sep 28;137(10):236. doi: 10.1007/s00122-024-04721-x. Theor Appl Genet. 2024. PMID: 39340575 Free PMC article. - A kinase fusion protein from Aegilops longissima confers resistance to wheat powdery mildew.
He H, Chen Z, Fan R, Zhang J, Zhu S, Wang J, Zhang Q, Gao A, Gong S, Zhang L, Li Y, Zhao Y, Krattinger SG, Shen QH, Li H, Wang Y. He H, et al. Nat Commun. 2024 Aug 2;15(1):6512. doi: 10.1038/s41467-024-50909-6. Nat Commun. 2024. PMID: 39095395 Free PMC article. - Exploring the genetic architecture of powdery mildew resistance in wheat through QTL meta-analysis.
Sharma D, Budhlakoti N, Kumari A, Saini DK, Sharma A, Yadav A, Mir RR, Singh AK, Vikas VK, Singh GP, Kumar S. Sharma D, et al. Front Plant Sci. 2024 Jul 3;15:1386494. doi: 10.3389/fpls.2024.1386494. eCollection 2024. Front Plant Sci. 2024. PMID: 39022610 Free PMC article. - Alternative splicing of a potato disease resistance gene maintains homeostasis between growth and immunity.
Sun B, Huang J, Kong L, Gao C, Zhao F, Shen J, Wang T, Li K, Wang L, Wang Y, Halterman DA, Dong S. Sun B, et al. Plant Cell. 2024 Sep 3;36(9):3729-3750. doi: 10.1093/plcell/koae189. Plant Cell. 2024. PMID: 38941447
References
- Savary S, et al. The global burden of pathogens and pests on major food crops. Nat Ecol Evol. 2019;3:430–439. - PubMed
- Singh RP, Rajaram S. Breeding for disease resistance in wheat in Bread wheat: improvement and production. Food and Agriculture Organization of the United Nations. 2002
- Pink DAC. Strategies using genes for non-durable disease resistance. Euphytica. 2002;124:227–236.
MeSH terms
Substances
Supplementary concepts
LinkOut - more resources
Full Text Sources
Other Literature Sources
Miscellaneous
