Drug repositioning to target NSP15 protein on SARS-CoV-2 as possible COVID-19 treatment - PubMed (original) (raw)
. 2021 May 15;42(13):897-907.
doi: 10.1002/jcc.26512. Epub 2021 Mar 13.
Affiliations
- PMID: 33713492
- PMCID: PMC8250597
- DOI: 10.1002/jcc.26512
Drug repositioning to target NSP15 protein on SARS-CoV-2 as possible COVID-19 treatment
Yudibeth Sixto-López et al. J Comput Chem. 2021.
Abstract
SARS-CoV and SARS-CoV-2 belong to the subfamily Coronaviridae and infect humans, they are constituted by four structural proteins: Spike glycoprotein (S), membrane (M), envelope (E) and nucleocapsid (N), and nonstructural proteins, such as Nsp15 protein which is exclusively present on nidoviruses and is absent in other RNA viruses, making it an ideal target in the field of drug design. A virtual screening strategy to search for potential drugs was proposed, using molecular docking to explore a library of approved drugs available in the DrugBank database in order to identify possible NSP15 inhibitors to treat Covid19 disease. We found from the docking analysis that the antiviral drugs: Paritaprevir and Elbasvir, currently both approved for hepatitis C treatment which showed some of the lowest free binding energy values were considered as repositioning drugs to combat SARS-CoV-2. Furthermore, molecular dynamics simulations of the Apo and Holo-Nsp15 systems were performed in order to get insights about the stability of these protein-ligand complexes.
Keywords: COVID-19; Elbasvir; Nsp15; Paritaprevir; SARS-CoV-2; molecular dynamic simulation.
© 2021 Wiley Periodicals LLC.
Figures
SCHEME 1
Elbasvir and Paritaprevir, drugs proposed with possible activity against Nsp15 of SARS‐CoV‐2, obtained by virtual screening approach
FIGURE 1
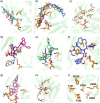
Binding poses of the 16 compounds selected by virtual screening obtained by molecular docking simulations against Nsp15 of SARS‐CoV‐2. (A) Difenoxine and Levocabastine (shown in color light pink and cyan, respectively), (B) Digoxin, Deslanoside, Acetyldigitoxin, Digitoxin (shown in color yellow‐orange, marine, violet purple and yellow, respectively), (C) Elbasvir (shown in color wheat), (D) Ergotamine and dyhydroergotamine (shown in magenta and gray, respectively), (E) Ivosidenib and entrectinib (shown in color deepteal and tvgreen, respectively), (F) Paritaprevir (slate color), (G) Atavaquone, Bedaquiline, Sibutramine (shown in magenta, gray and olive color, respectively), (H) irinotecan (shown in wheat color), (I) Nsp15 and close up of the catalytic site. Nsp15 are depicted as green cartoon and residues belonging to catalytic site as orange ball and stick, ligands are depicted as stick
FIGURE 2
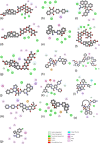
Interactions observed between ligands and NSP15 of SARS‐CoV‐2 obtained by molecular docking. (A) Acetyldigitoxin, (B) Atavaquone, (C) Bedaquiline, (D) Digitoxin, (E) Difenoxin, (F) Deslanosido, (G) Digoxin, (H) Dihydroergotamine, (I) Elbasvir, (J) Ergotamine, (K) Entrectinib, (L) Ivodesinib, (M) Irinotecan, (N) Levocabastin, (O) Paritaprevir, (P) Sibutramine. Interactions are color coded as indicated at the right bottom of the figure, that was built using discovery studio V1626
FIGURE 3
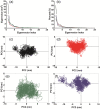
Geometrical parameters of 30 ns MD simulations. Carbon alpha atoms were considered for the calculations employing GROMACS program. (A) RMSD and (B) RMSF. Apo Nsp15 is depicted as black lines, while complex Nsp15‐Elbasvir is depicted in red and Nsp15‐Paritaprevir is depicted as blue line
FIGURE 4
Most populated cluster conformation retrieved from the MD simulation. (A) Apo Nsp15, (B) Nsp15‐Elbasvir, (C) Nsp15‐Paritaprevir and (D) Nsp15‐citrate. In panel A native Nsp15 is overlapped with most populated cluster conformation of apo Nsp15. Native Nsp15 is depicted as cyan ribbon, while most populated cluster conformation of each system is depicted as green ribbon. Ligands are depicted as cyan ball and stick and the residues with which ligands interacted are depicted as orange sticks
FIGURE 5
Principal component analysis of apo‐Nsp15 and holo trajectories. (A) The first 20 eigenvectors of the covariance matrix, (B) Percentage of each eigenvectors vs eigenvalues, only the first 20 eigenvectors are depicted, (C) projection of the motion in the phase space along the first and second eigenvectors (PC2 vs. PC1) of the apo Nsp15, (D) projection of the motion in the phase space along the first and second eigenvectors (PC2 vs. PC1) of the complex Nsp15‐Elbasvir, (E) projection of the motion in the phase space along the first and second eigenvectors (PC2 vs. PC1) of the complex Nsp15‐Paritaprevir, (F) projection of the motion in the phase space along the first and second eigenvectors (PC2 vs. PC1) of the complex Nsp15‐citrate. Nsp15 are depicted in black, Nsp15‐Elbasvir in red, Nsp15‐Paritaprevir in green and Nsp15‐citrate in purple
FIGURE 6
Graphical representation of the two extreme projections. Representation of the two extreme projections along the first eigen vector of MD simulation of (A) apo Nsp15, (B) Nsp‐Elbasvir, (C) Nsp15‐Paritaprevir, and (D) Nsp15‐citrate
Similar articles
- Molecular Docking and Virtual Screening Based Prediction of Drugs for COVID-19.
Talluri S. Talluri S. Comb Chem High Throughput Screen. 2021;24(5):716-728. doi: 10.2174/1386207323666200814132149. Comb Chem High Throughput Screen. 2021. PMID: 32798373 - Pharmacoinformatics approach based identification of potential Nsp15 endoribonuclease modulators for SARS-CoV-2 inhibition.
Savale RU, Bhowmick S, Osman SM, Alasmary FA, Almutairi TM, Abdullah DS, Patil PC, Islam MA. Savale RU, et al. Arch Biochem Biophys. 2021 Mar 30;700:108771. doi: 10.1016/j.abb.2021.108771. Epub 2021 Jan 21. Arch Biochem Biophys. 2021. PMID: 33485847 Free PMC article. - Multi-targeting approach for nsp3, nsp9, nsp12 and nsp15 proteins of SARS-CoV-2 by Diosmin as illustrated by molecular docking and molecular dynamics simulation methodologies.
Kumar S, Sharma PP, Upadhyay C, Kempaiah P, Rathi B, Poonam. Kumar S, et al. Methods. 2021 Nov;195:44-56. doi: 10.1016/j.ymeth.2021.02.017. Epub 2021 Feb 25. Methods. 2021. PMID: 33639316 Free PMC article. - The coronavirus nsp15 endoribonuclease: A puzzling protein and pertinent antiviral drug target.
Van Loy B, Stevaert A, Naesens L. Van Loy B, et al. Antiviral Res. 2024 Aug;228:105921. doi: 10.1016/j.antiviral.2024.105921. Epub 2024 May 31. Antiviral Res. 2024. PMID: 38825019 Review. - Danoprevir for the Treatment of Hepatitis C Virus Infection: Design, Development, and Place in Therapy.
Miao M, Jing X, De Clercq E, Li G. Miao M, et al. Drug Des Devel Ther. 2020 Jul 14;14:2759-2774. doi: 10.2147/DDDT.S254754. eCollection 2020. Drug Des Devel Ther. 2020. PMID: 32764876 Free PMC article. Review.
Cited by
- Effectiveness of Remdesivir in Comparison with Five Approved Antiviral Drugs for Inhibition of RdRp in Combat with SARS-CoV-2.
Mahdian S, Arab SS. Mahdian S, et al. Iran J Sci Technol Trans A Sci. 2022;46(5):1359-1367. doi: 10.1007/s40995-022-01364-9. Epub 2022 Sep 24. Iran J Sci Technol Trans A Sci. 2022. PMID: 36187298 Free PMC article. - Discovery of adapalene and dihydrotachysterol as antiviral agents for the Omicron variant of SARS-CoV-2 through computational drug repurposing.
Fidan O, Mujwar S, Kciuk M. Fidan O, et al. Mol Divers. 2023 Feb;27(1):463-475. doi: 10.1007/s11030-022-10440-6. Epub 2022 May 4. Mol Divers. 2023. PMID: 35507211 Free PMC article. - Model exploration for discovering COVID-19 targeted traditional Chinese medicine.
Sun Y, An X, Jin D, Duan L, Zhang Y, Yang C, Duan Y, Zhou R, Zhao Y, Zhang Y, Kang X, Jiang L, Lian F. Sun Y, et al. Heliyon. 2022 Dec;8(12):e12333. doi: 10.1016/j.heliyon.2022.e12333. Epub 2022 Dec 10. Heliyon. 2022. PMID: 36530927 Free PMC article. - Genome sequence analysis of nsp15 from SARS-CoV-2.
Yashvardhini N, Jha DK, Kumar A, Gaurav M, Sayrav K. Yashvardhini N, et al. Bioinformation. 2022 Apr 30;18(4):432-437. doi: 10.6026/97320630018432. eCollection 2022. Bioinformation. 2022. PMID: 36909703 Free PMC article. - The Interplay Between Coronavirus and Type I IFN Response.
Xue W, Ding C, Qian K, Liao Y. Xue W, et al. Front Microbiol. 2022 Mar 4;12:805472. doi: 10.3389/fmicb.2021.805472. eCollection 2021. Front Microbiol. 2022. PMID: 35317429 Free PMC article. Review.
References
- Fehr A. R., Perlman S., in Methods in Molecular Biology (Ed: Clifton N. J.) Humana Press, New York, NY: 2015, p. 1.
- Rota P. A., Oberste M. S., Monroe S. S., Nix W. A., Campagnoli R., Icenogle J. P., Penaranda S., Bankamp B., Maher K., Chen M. H., Tong S., Tamin A., Lowe L., Frace M., DeRisi J. L., Chen Q., Wang D., Erdman D. D., Peret T. C., Burns C., Ksiazek T. G., Rollin P. E., Sanchez A., Liffick S., Holloway B., Limor J., McCaustland K., Olsen‐Rasmussen M., Fouchier R., Gunther S., Osterhaus A. D., Drosten C., Pallansch M. A., Anderson L. J., Bellini W. J., Science 2003, 300, 1394. - PubMed
Publication types
MeSH terms
Substances
LinkOut - more resources
Full Text Sources
Other Literature Sources
Miscellaneous


