Lifelong restriction of dietary branched-chain amino acids has sex-specific benefits for frailty and lifespan in mice - PubMed (original) (raw)
doi: 10.1038/s43587-020-00006-2. Epub 2021 Jan 14.
Nicole E Richardson 1 2 3, Haley S Schuster 1 2, Alexis T Mitchell 1 2, Colin Boyle 1 2, Allison C Rodgers 1, Megan Finke 1 2, Lexington R Haider 1 2, Deyang Yu 1 2, Victoria Flores 1 2 4, Heidi H Pak 1 2 4, Soha Ahmad 1 2, Sareyah Ahmed 1 2, Abigail Radcliff 1 2, Jessica Wu 1 2, Elizabeth M Williams 1 2, Lovina Abdi 1 2, Dawn S Sherman 1 2, Timothy Hacker 1, Dudley W Lamming 1 2 3 4 5
Affiliations
- PMID: 33796866
- PMCID: PMC8009080
- DOI: 10.1038/s43587-020-00006-2
Lifelong restriction of dietary branched-chain amino acids has sex-specific benefits for frailty and lifespan in mice
Nicole E Richardson et al. Nat Aging. 2021 Jan.
Abstract
Protein restricted (PR) diets promote health and longevity in many species. While the precise components of a PR diet that mediate the beneficial effects to longevity have not been defined, we recently showed that many metabolic effects of PR can be attributed to reduced dietary levels of the branched-chain amino acids (BCAAs) leucine, isoleucine, and valine. Here, we demonstrate that restricting dietary BCAAs increases the survival of two different progeroid mouse models, delays frailty and promotes the metabolic health of wild-type C57BL/6J mice when started in midlife, and leads to a 30% increase in lifespan and a reduction in frailty in male, but not female, wild-type mice when fed lifelong. Our results demonstrate that restricting dietary BCAAs can increase healthspan and longevity in mice, and suggest that reducing dietary BCAAs may hold potential as a translatable intervention to promote healthy aging.
Keywords: branched-chain amino acids; healthspan; lifespan; mTOR; mTORC1; progeria; protein restriction; rapamycin.
Conflict of interest statement
CONFLICT OF INTEREST STATEMENT D.W.L has received funding from, and is a scientific advisory board member of, Aeovian Pharmaceuticals, which seeks to develop novel, selective mTOR inhibitors for the treatment of various diseases. The University of Wisconsin-Madison has applied for a patent for the use of branched-chain amino acid restricted diets to promote metabolic health, for which NER and DWL are inventors.
Figures
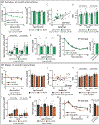
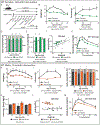
Extended Data Fig. 1. A Low BCAA diet promotes the metabolic health of aged wild-type mice
(A-G) Female and (H-N) Male C57BL/6J.Nia mice were fed the indicated diets beginning at 16 months of age. (A) The lean mass of a subset of female mice was tracked (n varies by month; maximum N = 10 biologically independent animals for both groups; * p < 0.05 (p value by month of age: 19 mo. = 0.0091, 21.5 mo. <0.0001, 24.5 mo. = 0.0004). (B) Food consumption over time calculated as total kcal/d (maximum N = 3 independent cages for both groups). (C) Energy expenditure (Heat) was assessed using metabolic chambers at 20 months of age (N; Control = 20, Low BCAA = 17 biologically independent animals). (D) Respiratory exchange ratio and (E) ambulatory movement was assessed using metabolic chambers at 20 and 25 months of age (maximum N; Control = 20, Low BCAA = 17 biologically independent animals; * p < 0.05 (p value for (D) by month of age: 20 mo. light=0.0056, dark=0.0105, 25 mo. dark=0.0012). (F) Area under the curve (AUC) corresponding to the glucose tolerance test in Figure 2G as well as repeat tests performed at 19 and 24 months of age (maximum N = 20 biologically independent animals for both groups; * p < 0.05, # p < 0.1 (p value by month of age: 17 mo. = 0.0034, 19 mo. = 0.0714, 24 mo. = 0.0016). (G) Insulin tolerance test and corresponding area under the curve after four weeks of diet feeding (N; Control = 20, Low BCAA = 15 biologically independent animals). (H) The lean mass of a subset of male mice was tracked (n varies by month; maximum N = 20 biologically independent animals for both groups, * p = 0.0066). (I) Food consumption over time calculated as total kcal/d (maximum N = 3 independent cages for both groups). (J) Energy expenditure (Heat) was assessed using metabolic chambers at 25 months of age (N = 13 biologically independent animals for both groups). (K) Respiratory exchange ratio and (L) ambulatory movement was assessed using metabolic chambers at 20 and 25 months of age (maximum N = 14 biologically independent animals for both groups). (M) AUC corresponding to glucose tolerance test in Figure 2M as well as repeat tests performed at 19 and 24 months of age (maximum N = 20 biologically independent animals for both groups; * p < 0.05 (p-value by month of age: 17 mo. = 0.0006, 19 mo. =0.0240, 24 mo. = 0.0026). (N) Insulin tolerance test and corresponding area under the curve after four weeks of diet feeding (N; Control = 10, Low BCAA = 9 biologically independent animals; * p = 0.0192). (A-B, D-F, H-I, K-M) Statistics for the overall effects of diet, age, and the interaction represent the p value from a mixed-effects model (restricted maximum likelihood [REML]) or two-way repeated measures ANOVA, multiple comparisons by two-sided Sidak’s post-test. (C, J) Energy expenditure data was analyzed by linear regression of energy expenditure by body weight (ANCOVA). (G, N) AUC comparisons were made by two-sided t-test, * p < 0.05. Data are represented as mean ± SEM.
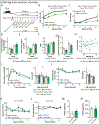
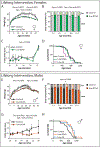
Extended Data Fig. 2. Effects of a lifelong Low BCAA diet on the healthspan of female mice
(A) Schematic showing timeline of measurements taken from male and female mice fed Control or Low BCAA diets, relevant to Fig. 5 and Extended Data Figs. 2 and 3. (B-N) Wild-type female mice were placed on either Control or Low BCAA diets at weaning. (B-C) The lean mass (B) and fat mass (C) of a subset of mice was tracked (n varies by month, maximum N; Control = 15, Low BCAA = 12 biologically independent animals). (B) * p < 0.05 (p-values for by month of age: 2.75 mo. = 0.0004. 5 mo. < 0.0001, 8.5 mo. = 0.0003, 15 mo. = 0.0341). (C)* p < 0.05, # p < 0.1 (p-values by month of age: 2 mo. = 0.0102, 8.5 mo. = 0.0695, 15 mo. = 0.0652). (D-E) Food consumption was calculated per gram of body weight (D) and by animal (E) (N; Control = 4, Low BCAA = 7 biologically independent animals). (F-H) Respiratory exchange ratio (F), ambulatory movement (G), and energy expenditure (heat) (H) were assessed using metabolic chambers at 5 months of age (N; Control = 6, Low BCAA = 7 biologically independent animals). (I) Glucose tolerance test at 2 months of age (N; Control = 18, Low BCAA = 16 biologically independent animals; * p < 0.05 (p-value by time: 0m = 0.0005, 15m = 0.0120, 60m = 0.0267), and corresponding area under the curve (AUC), also from tests performed at 3.5 and 12 months of age (maximum N; Control = 24, Low BCAA = 18 biologically independent animals; * p = 0.0063). (J) Insulin tolerance test at 2.5 months of age (N; Control = 13, Low BCAA = 12 biologically independent animals), and corresponding area under the curve, also from a test at 4 months of age (N; Control = 3, Low BCAA = 4 biologically independent animals). (K) Rotarod performance (n varies by month, maximum N; Control = 12, Low BCAA = 8 biologically independent animals) and (L) grip strength (n varies by month, maximum N; Control = 15, Low BCAA = 12 biologically independent animals) was assessed longitudinally. (M-N) Levels of insulin (M) and fibroblast growth factor 21 (FGF21) (N) were measured in serum by ELISA (16 months of age; N = 4 biologically independent animals per group). (B-N) Statistics for the overall effects of diet, age, and the interaction represent the p value from a mixed-effects model (restricted maximum likelihood [REML]), two-way repeated measures ANOVA, or a two-tailed, unpaired t-test in (M-N); multiple comparisons by two sided Sidak’s post-test. Data are represented as mean ± SEM.
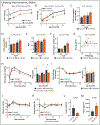
Extended Data Fig. 3. Effects of a lifelong Low BCAA diet on the healthspan of male mice
(A-M), Wild-type male mice were placed on either Control or Low BCAA diets at weaning. The (A) lean mass and (B) fat mass of a subset of mice was tracked (n varies by month, maximum N; Control = 11, Low BCAA = 8 biologically independent animals; * p < 0.05 (p-values for (A) by month of age: 2 mo. = 0.0028, 2.75 mo. = 0.0194, 5 mo. = 0.0011, 8.5 mo. = 0.0246; for (B) * p = 0.0095). Food consumption (N; Control = 4, Low BCAA = 6 biologically independent animals), was calculated (C) per gram of body weight and (D) by animal. (E) Respiratory exchange ratio, (F) ambulatory movement, and (G) energy expenditure (heat) were assessed using metabolic chambers at 5 months of age (E-G; N = 6 biologically independent animals for both groups). (H) Glucose tolerance test at 2 months of age (N; Control = 14, Low BCAA = 8 biologically independent animals), and corresponding area under the curve (AUC), also from tests performed at 3.5 and 12 months of age (maximum N; Control = 23, Low BCAA = 12 biologically independent animals; * p < 0.05 (p-values by month of age: 3.5 mo. = 0.0379, 12 mo. = 0.0054). (I) Insulin tolerance test at 2.5 months of age (N; Control = 15, Low BCAA = 13 biologically independent animals), and corresponding area under the curve, also from a test at 4 months of age (maximum N; Control = 15, Low BCAA = 13 biologically independent animals). (J) Rotarod performance (n varies by month, maximum N; Control = 15, Low BCAA = 12 biologically independent animals) and (K) grip strength (n varies by month, maximum N; Control = 12, Low BCAA = 8 biologically independent animals) were assessed longitudinally. Levels of (L) insulin and (M) fibroblast growth factor 21 (FGF21) were measured in serum by ELISA (16 months of age; N; Control = 5, Low BCAA = 4 biologically independent animals per group). (A-M) Statistics for the overall effects of diet, age, and the interaction represent the p value from a mixed-effects model (restricted maximum likelihood [REML]), two-way repeated measures ANOVA, or a two-tailed, unpaired t-test in (L-M); multiple comparisons by two-sided Sidak’s post-test. Data are represented as mean ± SEM.
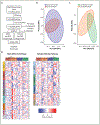
Extended Data Fig. 4. Transcriptional profiling of skeletal muscle
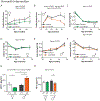
Transcriptional profiling was performed on mRNA from the skeletal muscle of male and female mice that consumed either Control or Low BCAA diets from weaning until 16 months of age (N = 6 biologically independent animals for all groups; Tables S13-S14). (A) Workflow from raw RNA sequencing reads through data analysis and data representation. (B-C) Principal component analysis for (B) Control and (C) Low BCAA fed groups. (D) Heatmaps of differentially expressed genes by mouse from significant KEGG over-representation analysis (ORA) pathways of interest identified in Tables S13B, S14B. DEGs were identified using an empirical Bayes moderated linear model. *Two-sided P values adjusted with the Benjamini–Hochberg procedure ORA was performed on DEGs (designated by an adjusted P value of 0.3 for female and 0.2 for male contrasts) using a one-sided hypergeometric test, and P values were adjusted using the Benjamini–Hochberg procedure.
Extended Data Fig. 5. A Low BCAA diet reduces mTORC1 activity in male, but not female, muscle.
(A-B) mTORC1 activity determined by Western blotting and quantification of muscle tissue lysates from male and female mice. Young (12 months females; 15 months males) and aged (22 months females; 25 months males) mice were fed either a Control or Low BCAA diets from 6.5 months of age for young and 16 months of age for aged mice, then sacrificed following an overnight fast followed by 4 hours of refeeding. (A) Male and (B) Female muscle. Quantification was by ImageJ (N = 3 biologically independent animals for all groups). (A-B) * p < 0.05 (p-values for (B); pS6/S6, Young CTL vs. Young LBC=0.0025; Young CTL vs. Aged CTL=0.0327; pS6K1/S6K1, Aged CTL vs. Aged LBC=0.0254). Statistics for the overall effects of diet, age and the interaction represent the p value from a two-way repeated measures ANOVA, multiple comparisons by two-sided Sidak’s post-test. Full scans of the cropped western blots shown here are provided as Source Data files. CTL=Control, LBC=Low BCAA. Data are represented as mean ± SEM.
Extended Data Fig. 6. A Low BCAA diet reduces mTORC1 signaling in the liver of male mice
(A-B) mTORC1 activity determined by Western blotting and quantification of liver tissue lysates from male and female mice. Young (12 months females; 15 months males) and aged (22 months females; 25 months males) mice were fed either a Control or Low BCAA diets from 6.5 months of age for young and 16 months of age for aged mice, then sacrificed following an overnight fast followed by 4 hours of refeeding. (A) Male and (B) female liver. Quantification was by ImageJ (N = 3 biologically independent animals for all groups). (A) * p < 0.05 (p-values for (A); pS6/S6, Young CTL vs. Young LBC=0.0028, Young CTL vs. Aged CTL=0.021; pS6K1/S6K1, Young CTL vs. Young LBC=0.0086, Young LBC vs. Aged LBC=0.0309; pULK1/ULK1, Aged CTL vs. Aged LBC = 0.0432, Young LBC vs. Aged LBC=0.003. (B) * p=0.0047, # = 0.056. Statistics for the overall effects of diet, age and the interaction represent the p value from a two-way repeated measures ANOVA, multiple comparisons by two-sided Sidak’s post-test. Full scans of the cropped western blots shown here are provided as Source Data files. CTL=Control, LBC=Low BCAA. Data are represented as mean ± SEM.
Figure 1:. Branched-chain amino acid restriction extends the lifespan of progeroid mice.
(A-B) Kaplan-Meier plots of the survival of _Lmna_−/− (A) females (N; Control = 9, Low BCAA = 18, Low AA = 13 biologically independent animals) and (B) males fed the indicated diets starting at weaning (N; Control = 20, Low BCAA = 14, Low AA = 10 biologically independent animals), see also Tables S2 and S3. (C) Echocardiography data of anterior and posterior left ventricular wall thickness (mm) in systole, and fractional shortening (%) in female wild-type and _Lmna_−/− mice fed the indicated diets from weaning to 40-55 days of age; full echocardiography data can be found in Table S4 (N; WT and _Lmna_−/− Control = 4, Low BCAA = 3, Low AA = 7 biologically independent animals; two-sided Dunnett’s test in comparison to _Lmna_−/− Control values post one-way ANOVA; LVAWs *p = 0.0224, LVPWs *p = 0.0406, FS #p = 0.0724). (D) Kaplan-Meier plot of the survival of _Lmna_G609G/G609G mice fed the indicated diets starting at weaning (N; Control = 15, Low BCAA = 12, Low AA = 8 biologically independent animals, Tables S3 and S5). Data are represented as mean ± SEM.
Figure 2:. A Low BCAA diet promotes the metabolic health of aged mice.
(A) Female and male C57BL/6J.Nia mice were fed Control or Low BCAA diets beginning at 16 months of age, schematic relevant to Figures 2-3 and Supplementary Tables 1 and 2. (B-G) Female C57BL/6J.Nia mice were fed the indicated diets beginning at 16 months of age. (B) The weight of the mice was tracked starting at 16 months of age (n varies by month; maximum N; Control = 20, Low BCAA = 19 biologically independent animals; * p < 0.05 (p-values by month of age: 18 mo. < 0.0001, 20 mo. < 0.0001, 22 mo. = 0.0016, 24.5 mo. = 0.0222). (C-D) The (C) fat mass and (D) body composition of a subset of mice was tracked (n varies by month; maximum N = 10 biologically independent animals for both groups; * p < 0.05 (p-values for (C) by month of age: 19 mo. = 0.0007, 21.5 mo. = 0.0052, 24.5 mo. = 0.016; p-values for (D) by month of age: 19 mo. = 0.0005, 21.5 mo. = 0.0134, 24.5 mo. = 0.0193). (E) Food consumption over time (maximum N = 3 independent cages for both groups; * p < 0.05 (p-values by month of age: 20 mo. = 0.0141, 25 mo. = 0.0082). (F) Energy expenditure (Heat) was assessed using metabolic chambers at 25 months of age (N; Control = 15, Low BCAA = 15 biologically independent animals). (G) Glucose tolerance test after three weeks of diet feeding (N; Control = 19, Low BCAA = 20 biologically independent animals; * p < 0.05; p-values by time: 0m = 0.0369, 45m = 0.0118, 60m = 0.0066, 120m = 0.0005). (H-M) Male C57BL/6J.Nia mice were fed the indicated diets beginning at 16 months of age. (H) The weight of the mice was tracked starting at 16 months of age (n varies by month; maximum N = 20 biologically independent animals for both groups; * p < 0.05, p-values by month of age: 18 mo. = 0.0005, 19-21.5 mo. <0.0001, 24 mo. = 0.0023, 26 mo. = 0.0073, 28 mo. = 0.0251). (I-J) The (I) fat mass and (J) body composition of a subset of mice was tracked (n varies by month; maximum N = 20 biologically independent animals for both groups; * p < 0.05 (p-values for (I) by month of age: 19-22 mo. < 0.0001; p-values for (J) by month of age: 19-22 mo. < 0.0001). (K) Food consumption of mice over time (maximum N = 3 independent cages for both groups). (L) Energy expenditure (Heat) was assessed using metabolic chambers at 20 months of age (N; Control = 14, Low BCAA = 13 biologically independent animals). (M) Glucose tolerance test after three weeks of diet feeding (N = 20 biologically independent animals for both groups; * p < 0.05, p-values by time: 15m = 0.0034, 30m = 0.0019, 45m = 0.0006, 60m = 0.0279, 120m = 0.0469). (B-E, H-K) Statistics for the overall effects of diet, age, and the interaction represent the p value from a mixed-effects model (restricted maximum likelihood [REML]) or two-way repeated measures ANOVA, multiple comparisons by two-sided Sidak’s post-test. (F, L) Energy expenditure data was analyzed by linear regression of energy expenditure by body weight (ANCOVA). (G, M) two-way repeated measures ANOVA, multiple comparisons by two-sided Sidak’s post-test. Data are represented as mean ± SEM.
Figure 3:. A Low BCAA diet promotes healthy aging
C57BL/6J.Nia mice were fed the indicated diets beginning at 16 months of age. (A-B) Frailty was assessed longitudinally in (A) female (n varies by month; maximum N; Control = 7, Low BCAA = 8 biologically independent animals) and (B) male mice starting at 23-24 months of age (n varies by month; maximum N = 10 biologically independent animals for both groups; * p < 0.05 (adjusted p-values by month of age: 29.5 mo. = 0.0075, 31 mo. = 0.003); average frailty by index measured can be found in Tables S6-7, respectively. (C-D) Grip strength (C) and rotarod (D) performance in females was assessed longitudinally. (E-F) Grip strength (E) and rotarod performance (F) in males was assessed longitudinally. (C-F) N varies by month; maximum N = 20 biologically independent animals for all groups. (A-F) Statistics for the overall effects of diet, age, and the interaction represent the p value from a mixed-effects model (restricted maximum likelihood [REML]) or two-way ANOVA; * p-values reported in (B) represent a two-sided Sidak’s post-test. (G-H) Levels of MCP-1 (G) and IGF-1 (H) in serum was determined by ELISA (22 months old female, 25 months male; N: females and Control males = 5, Low BCAA males = 4 biologically independent animals; statistics for the overall effects of diet, age/sex, and the interaction represent the p value from a two-way ANOVA, multiple comparisons by two-sided Sidak’s post-test; *p < 0.05, # p < 0.16, adjusted p-values in (G): CTL female vs. LBC female = 0.1016, CTL male vs. LBC male = 0.0034, LBC female vs. LBC male = 0.0002; # adjusted p-value in (H) CTL male vs. LBC male = 0.1525). CTL=Control, LBC=Low BCAA. Data are represented as mean ± SEM.
Figure 4:. A Low BCAA diet does not extend the lifespan of middle-aged mice.
(A-B) Kaplan-Meier plots showing the survival of (A) female (N = 34 biologically independent animals for both groups) and (B) male C57BL/6J.Nia mice fed the indicated diets starting at 16 months of age (N = 35 biologically independent animals for both groups) see also Table S8. (C) Percent of female mice with and without cancer observed at necropsy from lifespan in (A) (N; Control cancer = 17, Low BCAA cancer = 8, Control non-cancer = 8, Low BCAA non-cancer = 17 biologically independent animals). (D) Percent of males with and without cancer observed at necropsy from lifespan in (B) (N; Control cancer = 10, Low BCAA cancer = 9, Control non-cancer = 15, Low BCAA non-cancer = 16 biologically independent animals). (C-D) two-sided Fisher’s exact test, * p = 0.0254.
Figure 5:. Lifelong consumption of a Low BCAA diet promotes healthspan and extends male lifespan.
Wild-type female (A-E) and male (F-J) mice were placed on either Control or Low BCAA diets at weaning. (A) The weight of the female mice was tracked longitudinally (n varies by month, maximum N; Control = 35, Low BCAA = 22 biologically independent animals; * p < 0.05, adjusted p-values by month of age: 3.25 mo. = 0.0015, 4.75 mo. = 0.0136, 9.5 mo. = 0.0102, 10 mo. = 0.0341, 11 mo. = 0.0065, 12.25 mo. = 0.0393, 13.5 mo. = 0.0047, 15 mo. = 0.0057, 16.25 mo. = 0.0150, 17.25 mo. = 0.0323). (B) Female body composition (n varies by month, maximum N; Control = 15, Low BCAA = 12 biologically independent animals). (C) Female frailty was assessed longitudinally starting at 16 months of age (n varies by month, maximum N; Control = 25, Low BCAA = 18 biologically independent animals); average frailty by index measured can be found in Table S9. (D) Kaplan-Meier plot showing the survival of females fed the indicated diets from weaning (N; Control = 60, Low BCAA = 29, Low AA = 9 biologically independent animals, Table S10). (E) The weight of the male mice was tracked longitudinally (n varies by month, maximum N; Control = 22, Low BCAA = 23 biologically independent animals; * p < 0.05, adjusted p-values by month of age: 2.5 mo. = 0.0014, 3.25 mo. = 0.0190, 4 mo. = 0.0014, 4.75 mo. = 0.0028, 5.5 mo. = 0.0005, 10 mo. = 0.025, 11.25 mo. = 0.0283). (F) Male body composition, (n varies by month, maximum N; Control = 19, Low BCAA = 18 biologically independent animals; *p = 0.0154). (G) Male frailty was assessed longitudinally starting at 16 months of age (n varies by month, maximum N = 13 biologically independent animals for both groups; * p < 0.05, adjusted p-values by month of age: 31 mo. = 0.0409, 36 mo. = 0.0199); average frailty by index measured can be found in Table S11. (H) Kaplan Meier plot showing the survival of males fed the indicated diets from weaning (N; Control = 54, Low BCAA = 30, Low AA = 21 biologically independent animals, Table S10). (A-C, E-G) Statistics for the overall effects of diet, age, and the interaction represent the p value from a mixed-effects model (restricted maximum likelihood [REML]) or two-way repeated measures ANOVA, multiple comparisons by two-sided Sidak’s post-test. Data are represented as mean ± SEM.
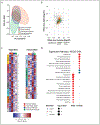
Figure 6:. Transcriptional profiling of skeletal muscle identifies male-specific changes in longevity-associated signaling pathways.
Transcriptional profiling was performed on mRNA from the skeletal muscle of male and female mice that consumed either Control or Low BCAA diets from weaning until 16 months of age (N = 6 biologically independent animals for all groups; Tables S13-14). (A) Principal component analysis. (B) Scatterplot showing effect size of Low BCAA diet feeding in males and females, colored according to significance in one, both, or neither group. (C) Heatmaps of differentially expressed genes from significant KEGG over-representation analysis (ORA) pathways of interest identified in Tables S13B, S14B. DEGs were identified using an empirical Bayes moderated linear model, * two-sided p-values adjusted with the Benjamini-Hochberg procedure. (D) Dotplot of significant pathways and direction changed from KEGG ORA in Table S13C, S14C. CTL=Control, LBC=Low BCAA. All overrepresentation analysis was performed using designated by an adjusted p value <0.3 for female and <0.2 for male contrasts in a one-sided hypergeometric test, and p-values were adjusted using the Benjamini-Hochberg procedure.
Comment in
- The coming of age for branched-chain amino acids.
Gao C, Cao N, Wang Y. Gao C, et al. J Cardiovasc Aging. 2021;1(2):10.20517/jca.2021.02. doi: 10.20517/jca.2021.02. Epub 2021 May 14. J Cardiovasc Aging. 2021. PMID: 34568877 Free PMC article. No abstract available.
Similar articles
- Dietary restriction of isoleucine increases healthspan and lifespan of genetically heterogeneous mice.
Green CL, Trautman ME, Chaiyakul K, Jain R, Alam YH, Babygirija R, Pak HH, Sonsalla MM, Calubag MF, Yeh CY, Bleicher A, Novak G, Liu TT, Newman S, Ricke WA, Matkowskyj KA, Ong IM, Jang C, Simcox J, Lamming DW. Green CL, et al. Cell Metab. 2023 Nov 7;35(11):1976-1995.e6. doi: 10.1016/j.cmet.2023.10.005. Cell Metab. 2023. PMID: 37939658 Free PMC article. - Restoration of metabolic health by decreased consumption of branched-chain amino acids.
Cummings NE, Williams EM, Kasza I, Konon EN, Schaid MD, Schmidt BA, Poudel C, Sherman DS, Yu D, Arriola Apelo SI, Cottrell SE, Geiger G, Barnes ME, Wisinski JA, Fenske RJ, Matkowskyj KA, Kimple ME, Alexander CM, Merrins MJ, Lamming DW. Cummings NE, et al. J Physiol. 2018 Feb 15;596(4):623-645. doi: 10.1113/JP275075. Epub 2017 Dec 27. J Physiol. 2018. PMID: 29266268 Free PMC article. - Protein restriction and branched-chain amino acid restriction promote geroprotective shifts in metabolism.
Trautman ME, Richardson NE, Lamming DW. Trautman ME, et al. Aging Cell. 2022 Jun;21(6):e13626. doi: 10.1111/acel.13626. Epub 2022 May 8. Aging Cell. 2022. PMID: 35526271 Free PMC article. Review. - The adverse metabolic effects of branched-chain amino acids are mediated by isoleucine and valine.
Yu D, Richardson NE, Green CL, Spicer AB, Murphy ME, Flores V, Jang C, Kasza I, Nikodemova M, Wakai MH, Tomasiewicz JL, Yang SE, Miller BR, Pak HH, Brinkman JA, Rojas JM, Quinn WJ 3rd, Cheng EP, Konon EN, Haider LR, Finke M, Sonsalla M, Alexander CM, Rabinowitz JD, Baur JA, Malecki KC, Lamming DW. Yu D, et al. Cell Metab. 2021 May 4;33(5):905-922.e6. doi: 10.1016/j.cmet.2021.03.025. Epub 2021 Apr 21. Cell Metab. 2021. PMID: 33887198 Free PMC article. - Branched-chain amino acids, mitochondrial biogenesis, and healthspan: an evolutionary perspective.
Valerio A, D'Antona G, Nisoli E. Valerio A, et al. Aging (Albany NY). 2011 May;3(5):464-78. doi: 10.18632/aging.100322. Aging (Albany NY). 2011. PMID: 21566257 Free PMC article. Review.
Cited by
- Animal Models Relevant for Geroscience: Current Trends and Future Perspectives in Biomarkers, and Measures of Biological Aging.
Bartolomucci A, Kane AE, Gaydosh L, Razzoli M, McCoy BM, Ehninger D, Chen BH, Howlett SE, Snyder-Mackler N. Bartolomucci A, et al. J Gerontol A Biol Sci Med Sci. 2024 Sep 1;79(9):glae135. doi: 10.1093/gerona/glae135. J Gerontol A Biol Sci Med Sci. 2024. PMID: 39126297 Review. - Current limitations and future opportunities of tracer studies of muscle ageing.
O'Reilly CL, Bodine SC, Miller BF. O'Reilly CL, et al. J Physiol. 2025 Jan;603(1):7-15. doi: 10.1113/JP285616. Epub 2023 Dec 5. J Physiol. 2025. PMID: 38051758 Free PMC article. No abstract available. - Role of amino acid metabolism in mitochondrial homeostasis.
Li Q, Hoppe T. Li Q, et al. Front Cell Dev Biol. 2023 Feb 27;11:1127618. doi: 10.3389/fcell.2023.1127618. eCollection 2023. Front Cell Dev Biol. 2023. PMID: 36923249 Free PMC article. Review. - New Insights into the Genetics and Epigenetics of Aging Plasticity.
Zhang J, Wang S, Liu B. Zhang J, et al. Genes (Basel). 2023 Jan 27;14(2):329. doi: 10.3390/genes14020329. Genes (Basel). 2023. PMID: 36833255 Free PMC article. Review. - Dietary Supplements and Natural Products: An Update on Their Clinical Effectiveness and Molecular Mechanisms of Action During Accelerated Biological Aging.
Chen Y, Hamidu S, Yang X, Yan Y, Wang Q, Li L, Oduro PK, Li Y. Chen Y, et al. Front Genet. 2022 Apr 28;13:880421. doi: 10.3389/fgene.2022.880421. eCollection 2022. Front Genet. 2022. PMID: 35571015 Free PMC article. Review.
References
- Weindruch R, Walford RL, Fligiel S, Guthrie D. The retardation of aging in mice by dietary restriction: longevity, cancer, immunity and lifetime energy intake. The Journal of nutrition 116, 641–654 (1986). - PubMed
- Speakman JR, Mitchell SE, Mazidi M. Calories or protein? The effect of dietary restriction on lifespan in rodents is explained by calories alone. Exp Gerontol 86, 28–38 (2016). - PubMed
METHODS-ONLY REFERENCES
- Fried LP, et al. Frailty in older adults: evidence for a phenotype. J Gerontol A Biol Sci Med Sci 56, M146–156 (2001). - PubMed
- Harris SP, et al. Hypertrophic cardiomyopathy in cardiac myosin binding protein-C knockout mice. Circ Res 90, 594–601 (2002). - PubMed
Publication types
MeSH terms
Substances
Grants and funding
- R56 AG056771/AG/NIA NIH HHS/United States
- F31 AG066311/AG/NIA NIH HHS/United States
- I01 BX004031/BX/BLRD VA/United States
- R21 AG050135/AG/NIA NIH HHS/United States
- R00 AG041765/AG/NIA NIH HHS/United States
- R01 AG056771/AG/NIA NIH HHS/United States
- P30 CA014520/CA/NCI NIH HHS/United States
- R21 AG051974/AG/NIA NIH HHS/United States
- R01 AG062328/AG/NIA NIH HHS/United States
- T32 AG000213/AG/NIA NIH HHS/United States
- RF1 AG056771/AG/NIA NIH HHS/United States
- K99 AG041765/AG/NIA NIH HHS/United States
LinkOut - more resources
Full Text Sources
Other Literature Sources
Research Materials
Miscellaneous
