Deletion of CTCF sites in the SHH locus alters enhancer-promoter interactions and leads to acheiropodia - PubMed (original) (raw)
. 2021 Apr 16;12(1):2282.
doi: 10.1038/s41467-021-22470-z.
Yichi Zhang 1 2 3, Chenling Xiong 1 2, Jingjing Zhao 1 2, Ilias Georgakopoulos-Soares 1 2, Lauren Kane 4, Kirsty Jamieson 2, Michael J Bamshad 5 6 7, Deborah A Nickerson 6 7; University of Washington Center for Mendelian Genomics; Yin Shen 2 8, Laura A Lettice 4, Elizabeth Lemos Silveira-Lucas 9, Florence Petit 10, Nadav Ahituv 11 12
Affiliations
- PMID: 33863876
- PMCID: PMC8052326
- DOI: 10.1038/s41467-021-22470-z
Deletion of CTCF sites in the SHH locus alters enhancer-promoter interactions and leads to acheiropodia
Aki Ushiki et al. Nat Commun. 2021.
Abstract
Acheiropodia, congenital limb truncation, is associated with homozygous deletions in the LMBR1 gene around ZRS, an enhancer regulating SHH during limb development. How these deletions lead to this phenotype is unknown. Using whole-genome sequencing, we fine-mapped the acheiropodia-associated region to 12 kb and show that it does not function as an enhancer. CTCF and RAD21 ChIP-seq together with 4C-seq and DNA FISH identify three CTCF sites within the acheiropodia-deleted region that mediate the interaction between the ZRS and the SHH promoter. This interaction is substituted with other CTCF sites centromeric to the ZRS in the disease state. Mouse knockouts of the orthologous 12 kb sequence have no apparent abnormalities, showcasing the challenges in modelling CTCF alterations in animal models due to inherent motif differences between species. Our results show that alterations in CTCF motifs can lead to a Mendelian condition due to altered enhancer-promoter interactions.
Conflict of interest statement
The authors declare no competing interests.
Figures
Fig. 1. Fine-mapping of the acheiropodia-associated deletion.
a Pedigree of acheiropodia family with proband indicated via the arrow. Squares and circles represent males and females, respectively. b WGS alignments showing a homozygous 12 kb deletion in the acheiropodia proband. The Y-axis is the read depth (number of reads for each nucleotide). The deletion appears in a heterozygous manner in both parents. BP: breakpoint; P: proband; M: mother; F: father. c PCR amplification using three different primers pairs, whose location is indicated in b, further confirming the breakpoint in the proband (P) and mother (M) and father (F). PCR was performed several times using different primer sets to validate the deletion. d Sanger sequencing of the acheiropodia patient showing the breakpoint sequence which also has a CA insertion.
Fig. 2. Mouse transgenic enhancer assay for the 12 kb acheiropodia-associated sequence.
Schematic representation of the mouse transgenic enhancer assay (upper panel) showing the 12 kb acheiropodia-associated sequence cloned upstream of the Hsp68 promoter-LacZ gene. Enhancer activity, as visualized by LacZ staining, was not observed in the ZPA for the six PCR positive E11.5 mouse embryos (lower panel).
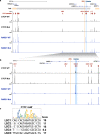
Fig. 3. CTCF and RAD21 distribution in the LMBR1-SHH locus.
a CTCF and RAD21 ChIP-seq enrichment in lymphoblastoid cells from wildtype (WT) and proband (Mut) at the LMBR1-SHH locus. GM12878 (lymphoblastoid cell line) TAD boundaries are shown in orange and gray horizontal bar. ZRS and the acheiropodia-associated deleted region are shown in orange and blue vertical lines respectively. CTCF orientations are shown as red triangles. The _Y_-axis is the signal _P_-value to reject the null hypothesis that the signal at that location is present in the control. b Zoom in of the region around the LMBR1 gene. c CTCF motif from JASPAR [
] and CTCF motif scores, as assigned by FIMO, overlapping CTCF peaks in the LMBR1 locus.
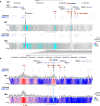
Fig. 4. Chromatin interactions with the SHH promoter.
a 4C contact profiles in lymphoblastoid cells from wildtype (WT) and proband (Mut) at the _LMBR1_-SHH locus. The viewpoint is depicted by a black arrowhead. The median and 20th and 80th percentiles of sliding 2–50 kb windows determine the main trend line. The color scale represents enrichment relative to the maximum medium value attainable at 12 kb resolution. CTCF and RAD21 ChIP-seq peaks are shown as black and blue vertical line respectively. The ZRS and the acheiropodia-associated deleted region are shown as orange and blue vertical lines respectively. CTCF orientations are shown as red triangles. b Zoom in of the region around the LMBR1 gene.
Fig. 5. DNA FISH showing the SHH promoter interaction with the acheiropodia-associated region.
a Schematic of the LMBR1-SHH locus showing the ZRS and the acheiropodia-associated deleted region via orange and blue vertical lines respectively. CTCF orientations are shown as red triangles and the locations to which the DNA FISH probes hybridize to are depicted by light blue bars. b Images of representative nuclei from DNA FISH analysis of parental and proband lymphoblastoid cells showing FISH signals for SHH, LSC2, LSC3-5, and 12 kb probes. Scale bars: 5 µm. c Violin plots showing the distribution of interprobe distances (µm) between SHH – LSC1, SHH – LSC2, and SHH – Deletion. The wild-type allele was distinguished from the mutant allele in the parental cell line using the 12 kb probe. SHH – deletion is measured from SHH to 12 kb probe on the wild-type allele and from SHH to LSC3-5 probe on the mutant allele. The statistical significance between datasets was examined by a two-sided Mann–Whitney U-test, ** = 0.004537 and **** = 2.083×10⁻¹¹ (n = 75–150 alleles).
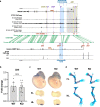
Fig. 6. Human and mouse genomic comparisons and phenotype of mice where the orthologous region was deleted.
a Comparison of the LMBR1-SHH locus between human and mice. CTCF site deletions analyzed by Paliou et al. are marked by purple lines and those generated by #, Williamson et al. are denoted by yellow lines or gray rectangle, and marked by *. CTCF motif orientation is shown via red triangles. The acheiropodia-associated deletion and its mouse orthologous sequence are depicted by a blue rectangle. Mouse limb CTCF ChIP-seq data from ENCODE, Andrey et al., Paliou et al. and human CTCF ChIP-seq data from this study (WT = wild type; Mut=proband) are shown as black genomic tracks below the locus. The conservation track is adopted from the Ensembl Genome Browser with green lines indicating conserved sequences between humans and mice. b Shh gene expression levels dissected from E11.5 mouse autopods from wild type (WT) and knockout (KO) mice as determined by qRT-PCR. Each value represents the ratio of Shh gene expression to that of β-Actin, and values are mean ± standard deviation. The expression value of WT group was arbitrarily set at 1.0. Each dot represents one embryo and statistical differences were determined using a two-sided unpaired t test (P = 0.7796, N.S., not significant). Source data are provided as a Source Data file. c Whole-mount in situ hybridization for Shh of wild type (WT) and knockout (KO) E11.5 mouse embryos. Forelimbs (FL) and hindlimbs (HL) were dissected and shown in the lower panel. d Wild type (WT) and knockout (KO) E18.5 limb skeletal staining using alizarin red/alcian blue.
Fig. 7. Proposed model for the aberrant chromatin structure of the _LMBR1_-SHH locus in the acheiropodia patient.
Model of chromatin structure in the _LMBR1_-SHH locus based on our ChIP-seq and 4C-seq data. CTCF sites are shown as red triangles and the cohesin complex is shown as a green ring. The ZRS is depicted as an orange oval.
Similar articles
- Preformed chromatin topology assists transcriptional robustness of Shh during limb development.
Paliou C, Guckelberger P, Schöpflin R, Heinrich V, Esposito A, Chiariello AM, Bianco S, Annunziatella C, Helmuth J, Haas S, Jerković I, Brieske N, Wittler L, Timmermann B, Nicodemi M, Vingron M, Mundlos S, Andrey G. Paliou C, et al. Proc Natl Acad Sci U S A. 2019 Jun 18;116(25):12390-12399. doi: 10.1073/pnas.1900672116. Epub 2019 May 30. Proc Natl Acad Sci U S A. 2019. PMID: 31147463 Free PMC article. - Acheiropodia is caused by a genomic deletion in C7orf2, the human orthologue of the Lmbr1 gene.
Ianakiev P, van Baren MJ, Daly MJ, Toledo SP, Cavalcanti MG, Neto JC, Silveira EL, Freire-Maia A, Heutink P, Kilpatrick MW, Tsipouras P. Ianakiev P, et al. Am J Hum Genet. 2001 Jan;68(1):38-45. doi: 10.1086/316955. Epub 2000 Nov 22. Am J Hum Genet. 2001. PMID: 11090342 Free PMC article. - Developmentally regulated Shh expression is robust to TAD perturbations.
Williamson I, Kane L, Devenney PS, Flyamer IM, Anderson E, Kilanowski F, Hill RE, Bickmore WA, Lettice LA. Williamson I, et al. Development. 2019 Sep 30;146(19):dev179523. doi: 10.1242/dev.179523. Development. 2019. PMID: 31511252 Free PMC article. - Dissecting CTCF site function in a tense HoxD locus.
Bruneau BG. Bruneau BG. Genes Dev. 2021 Nov 1;35(21-22):1401-1402. doi: 10.1101/gad.349089.121. Genes Dev. 2021. PMID: 34725128 Free PMC article. Review. - Many facades of CTCF unified by its coding for three-dimensional genome architecture.
Wu Q, Liu P, Wang L. Wu Q, et al. J Genet Genomics. 2020 Aug;47(8):407-424. doi: 10.1016/j.jgg.2020.06.008. Epub 2020 Sep 1. J Genet Genomics. 2020. PMID: 33187878 Review.
Cited by
- Characterization of 22q12 Microdeletions Causing Position Effect in Rare NF2 Patients with Complex Phenotypes.
Tritto V, Eoli M, Paterra R, Redaelli S, Moscatelli M, Rusconi F, Riva P. Tritto V, et al. Int J Mol Sci. 2022 Sep 2;23(17):10017. doi: 10.3390/ijms231710017. Int J Mol Sci. 2022. PMID: 36077416 Free PMC article. - Sequential in cis mutagenesis in vivo reveals various functions for CTCF sites at the mouse HoxD cluster.
Amândio AR, Beccari L, Lopez-Delisle L, Mascrez B, Zakany J, Gitto S, Duboule D. Amândio AR, et al. Genes Dev. 2021 Nov 1;35(21-22):1490-1509. doi: 10.1101/gad.348934.121. Epub 2021 Oct 28. Genes Dev. 2021. PMID: 34711654 Free PMC article. - Chromatin Alterations in Neurological Disorders and Strategies of (Epi)Genome Rescue.
Janowski M, Milewska M, Zare P, Pękowska A. Janowski M, et al. Pharmaceuticals (Basel). 2021 Aug 4;14(8):765. doi: 10.3390/ph14080765. Pharmaceuticals (Basel). 2021. PMID: 34451862 Free PMC article. Review. - Esearch3D: propagating gene expression in chromatin networks to illuminate active enhancers.
Heer M, Giudice L, Mengoni C, Giugno R, Rico D. Heer M, et al. Nucleic Acids Res. 2023 Jun 9;51(10):e55. doi: 10.1093/nar/gkad229. Nucleic Acids Res. 2023. PMID: 37021559 Free PMC article. - CTCF shapes chromatin structure and gene expression in health and disease.
Dehingia B, Milewska M, Janowski M, Pękowska A. Dehingia B, et al. EMBO Rep. 2022 Sep 5;23(9):e55146. doi: 10.15252/embr.202255146. Epub 2022 Aug 22. EMBO Rep. 2022. PMID: 35993175 Free PMC article. Review.
References
Publication types
MeSH terms
Substances
Supplementary concepts
Grants and funding
- MC_UU_00007/8/MRC_/Medical Research Council/United Kingdom
- P01 HD084387/HD/NICHD NIH HHS/United States
- U24 HG008956/HG/NHGRI NIH HHS/United States
- R01 HD059862/HD/NICHD NIH HHS/United States
- S10 OD021553/OD/NIH HHS/United States
- UM1 HG006493/HG/NHGRI NIH HHS/United States
- MM_UU_00007/8/MRC_/Medical Research Council/United Kingdom
LinkOut - more resources
Full Text Sources
Other Literature Sources
Molecular Biology Databases


