Expanded diversity of Asgard archaea and their relationships with eukaryotes - PubMed (original) (raw)
. 2021 May;593(7860):553-557.
doi: 10.1038/s41586-021-03494-3. Epub 2021 Apr 28.
Kira S Makarova # 2, Wen-Cong Huang # 1, Yuri I Wolf 2, Anastasia N Nikolskaya 2, Xinxu Zhang 1, Mingwei Cai 1, Cui-Jing Zhang 1, Wei Xu 3, Zhuhua Luo 3, Lei Cheng 4, Eugene V Koonin 5, Meng Li 6
Affiliations
- PMID: 33911286
- PMCID: PMC11165668
- DOI: 10.1038/s41586-021-03494-3
Expanded diversity of Asgard archaea and their relationships with eukaryotes
Yang Liu et al. Nature. 2021 May.
Abstract
Asgard is a recently discovered superphylum of archaea that appears to include the closest archaeal relatives of eukaryotes1-5. Debate continues as to whether the archaeal ancestor of eukaryotes belongs within the Asgard superphylum or whether this ancestor is a sister group to all other archaea (that is, a two-domain versus a three-domain tree of life)6-8. Here we present a comparative analysis of 162 complete or nearly complete genomes of Asgard archaea, including 75 metagenome-assembled genomes that-to our knowledge-have not previously been reported. Our results substantially expand the phylogenetic diversity of Asgard and lead us to propose six additional phyla that include a deep branch that we have provisionally named Wukongarchaeota. Our phylogenomic analysis does not resolve unequivocally the evolutionary relationship between eukaryotes and Asgard archaea, but instead-depending on the choice of species and conserved genes used to build the phylogeny-supports either the origin of eukaryotes from within Asgard (as a sister group to the expanded Heimdallarchaeota-Wukongarchaeota branch) or a deeper branch for the eukaryote ancestor within archaea. Our comprehensive protein domain analysis using the 162 Asgard genomes results in a major expansion of the set of eukaryotic signature proteins. The Asgard eukaryotic signature proteins show variable phyletic distributions and domain architectures, which is suggestive of dynamic evolution through horizontal gene transfer, gene loss, gene duplication and domain shuffling. The phylogenomics of the Asgard archaea points to the accumulation of the components of the mobile archaeal 'eukaryome' in the archaeal ancestor of eukaryotes (within or outside Asgard) through extensive horizontal gene transfer.
Conflict of interest statement
Competing interests The authors declare no competing interests.
Figures
Extended Data Fig. 1 |. Global distribution of the Asgard genomes analysed in this Article.
The world map was generated using R package rnaturalearth v.0.1.0., in R v.3.6.3. The pie chart shows the proportion of Asgard genomes that were found in a given biotope. The numbers of these genomes per biotope are as follows: coastal sediment, 94; freshwater sediment, 15; hot spring, 1; hydrothermal vent, 13; hypersaline lake sediment, 1; marine sediment 26; marine water, 26; petroleum seep (marine), 6; and petroleum field, 1. Boldface in the map indicates the sampling locations.
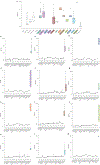
Extended Data Fig. 2 |. Completeness and contamination for 75 Asgard MAGs.
These MAGs were assessed using CheckM v.1.0.12. a, Distribution of completeness and contamination for 75 Asgard MAGs assessed by CheckM v.1.0.12. b, c, Distribution of depth coverage (b) and N50 statistics (c) for Asgard MAGs reconstructed in this Article. The numbers in parentheses indicate the number of Asgard genomes recovered from a given sampling location. In cases in which fewer than three samples were recovered, these are presented as individual points. Thick black bar, median; upper and lower bounds of the box plot, first and third quartile, respectively; upper and lower whiskers, largest and smallest values less than 1.5× interquartile range, respectively; black points, values greater than 1.5× interquartile range. Data for this plot are given in Supplementary Table 1.
Extended Data Fig. 3 |. Gene commonality plot for Asgard archaea and the TACK superphylum.
Gene commonality plot showing the number of Asgard COGs (log scale) (y axis) that include the given fraction of analysed genomes (x axis). The Asgard plot is compared with the TACK superphylum plot on the basis of the assignment of TACK geznomes to archaeal COGs.
Extended Data Fig. 4 |. Comparison of the mean amino acid identity of Asgard and TACK superphyla.
In this figure, -archaeota is omitted from the phylum names. Sample sizes of less than three are presented as individual points. a, Shared amino acid identity across Asgard and TACK lineages. Comparison of representative genomes from all Asgard and TACK lineages analysed in this Article (excluding the six putative phyla proposed in this Article), which characterizes the distribution of amino acid identities that is typical of a phylum. b–m, Amino acid identity comparisons between Thorarchaeota (b), Hermodarchaeota (c), Odinarchaeota (d), Baldrarchaeota (e), Lokiarchaeota (f), Helarchaeota (g), Borrarchaeota (h), Heimdallarchaeota (i), Kariarchaeota ( j), Gerdarchaeota (k), Hodarchaeota (l) and Wukongarchaeota (m) and other Asgard and TACK lineages. Thick black bar, median; upper and lower bounds of the box plot, first and third quartile respectively; upper and lower whiskers, largest and smallest values less than 1.5× interquartile range, respectively; black points, values greater than 1.5× interquartile range; number in the parentheses, number of genomes in the lineage. Data for this plot are given in Supplementary Table 2.
Extended Data Fig. 5 |. Comparison of the 16S rRNA gene sequence identity of Asgard and TACK lineages.
In this figure, -archaeota is omitted from the phylum names. Sample sizes of less than three are presented as individual points. a, 16S rRNA gene sequence identity across Asgard and TACK lineages. Comparison of 16S RNA gene sequences from representative genomes of all Asgard and TACK lineages analysed in this Article (excluding the six putative phyla proposed in this Article), which characterizes the distribution of 16S rRNA sequence that is typical of a phylum. b–k, Comparison of 16S rRNA gene sequence identity between Thorarchaeota (b), Hermodarchaeota (c), Odinarchaeota (d), Lokiarchaeota (e), Helarchaeota (f), Heimdallarchaeota (g), Kariarchaeota (h), Gerdarchaeota (i), Hodarchaeota (j) and Wukongarchaeota (k) and other Asgard and TACK lineages. Thick black bar, median; upper and lower bounds of the box plot, first and third quartile respectively; upper and lower whiskers, largest and smallest values less than 1.5× interquartile range, respectively; black points, values greater than 1.5× interquartile range; number in the parentheses, number of genomes in the lineage. Data for this plot are given in Supplementary Table 3.
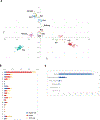
Extended Data Fig. 6 |. Classification of Asgard archaea by the phyletic patterns and the core gene set of Asgard archaea.
a, Classical multidimensional scaling analysis of binary presence–absence phyletic patterns for 13,939 Asgard COGs that are represented in at least two genomes (Methods). b, Functional breakdown of Asgard core genes (378 Asgard COGs) compared with TACK-superphylum core genes (489 archaeal COGs). Values were normalized as described in the Methods. Functional classes of genes: J, translation, ribosomal structure and biogenesis; K, transcription; L, replication, recombination and repair; D, cell cycle control, cell division and chromosome partitioning; V, defence mechanisms; T, signal transduction mechanisms; M, biogenesis of the cell wall, membrane or envelope; N, cell motility; U, intracellular trafficking, secretion and vesicular transport; O, posttranslational modification, protein turnover and chaperones; X, mobilome (prophages, plasmids and transposons); C, energy production and conversion; G, carbohydrate transport and metabolism; E, amino acid transport and metabolism; F, nucleotide transport and metabolism; H, coenzyme transport and metabolism; I, lipid transport and metabolism; P, inorganic ion transport and metabolism; Q, secondary metabolites biosynthesis, transport and catabolism; R, general function prediction only; S, function unknown. c, Presence–absence of orthologues of Asgard core genes in other archaea, bacteria and eukaryotes.
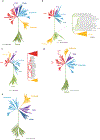
Extended Data Fig. 7 |. Phylogenetic trees.
a, Phylogenetic tree of bacteria, archaea and eukaryotes (inferred with IQ-tree using the LG + R10 model) that was constructed from the concatenated alignments of the protein sequences of 30 universally conserved genes (Methods). The tree shows the relationships between the major clades. b, Phylogenetic tree of COG0012 (ribosome-binding ATPase YchF) the tree was reconstructed using IQ-tree with LG + R10 evolutionary model (selected by IQ-tree ModelFinder as the best fit). zc, Phylogenetic tree of COG0201 (preprotein translocase subunit SecY). The tree was reconstructed using IQ-tree with LG + F + R10 evolutionary model (selected by IQ-tree ModelFinder as the best fit). d, Phylogenetic tree of the reduced set of bacteria, archaea and eukaryotes (excluding the genomes of derived parasites), constructed from concatenated alignments of the protein sequences of 29 universal markers (excluding COG0012) using IQ-tree with LG + R10 evolutionary model (selected by IQ-tree ModelFinder as the best fit). The tree shows the relationships between the major clades. e, Phylogenetic analysis of the evolutionary relationship between archaea and eukaryotes, excluding the Asgard superphylum. The tree was reconstructed from a concatenated alignment of the 29 universal markers (excluding COG0012) using IQ-tree with LG + R10 evolutionary model (selected by IQ-tree ModelFinder as the best fit).
Extended Data Fig. 8 |. Phyletic patterns of ESPs in Asgard genomes.
All 505 Asgard COGs that correspond to ESP are grouped by distance between binary presence–absence phyletic patterns. For a given pair of Asgard COGs A and B that are present in the set of genomes {_G_A} and {_G_B}, respectively, we calculate the similarity between the patterns as _S_A,B = |{_G_A} × {_G_B}|/|{_G_A}+{_G_B}|, and the distance between the patterns as _D_A,B = −ln(_S_A,B). A dendrogram was reconstructed using the unweighted-pair group method with arithmetic mean, from the distance matrix D; the order of leaves in the tree determines the order of Asgard COGs in the figure. Top, patterns are shown schematically by pale blue lines, in which the respective Asgard COG is present and mapped to the 12 major Asgard lineages (as shown by the coloured bar above). The Asgard COGs that correspond to the most highly conserved ESP protein families are shown within the red rectangle. Bottom, plot of the number of Asgard COGs that correspond to ESPs in each of 76 genomes is shown. Complete data are provided in Supplementary Table 7. The colour code for the plot is the same as for the bar graph.
Extended Data Fig. 9 |. Metabolic features of Asgard archaea.
Schematic of the presence and absence of selected metabolic features in all phyla and putative phyla of Asgard archaea.
Extended Data Fig. 10 |. Phylogenetic analysis of [NiFe] hydrogenases in Asgard archaea.
a, Phylogenetic analysis of group-4 [NiFe] hydrogenases in Asgard archaea. The unrooted maximum-likelihood phylogenetic tree was built from an alignment of 425 sequences that included 110 sequences of Asgard archaea, with 308 amino acid positions. b, Phylogenetic analysis of group-3 [NiFe] hydrogenases in Asgard archaea. The unrooted maximum-likelihood phylogenetic tree was built from an alignment of 813 sequences that included 335 sequences of Asgard archaea, with 331 amino acid positions. c, Phylogenetic analysis of group-1 [NiFe] hydrogenases in the Asgard archaea. The unrooted maximum-likelihood phylogenetic tree was built from an alignment of 541 sequences that included 2 sequences of Wukongarchaeota, with 376 amino acid positions.
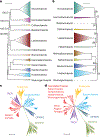
Fig. 1 |. Phylogenetic analysis of Asgard archaea and their relationships with eukaryotes.
a, Maximum likelihood tree (inferred with IQ-tree and the LG + F + R10 model) constructed from the concatenated alignments of the protein sequences from 209 core Asgard COGs. Only the 12 phylum-level clades are shown (species within each clade are collapsed) (Methods, Supplementary Table 5). Support values in parentheses indicate the frequency of the corresponding bipartition among 100 bootstrap-like samples of the 209 core Asgard COGs; where these are not indicated, both support values were 100. The root position was inferred from the global tree (c). Scale bar, 0.5 average amino acid substitutions per site. b, Maximum-likelihood tree (inferred with IQ-tree and the GTR + F + G model) on the basis of 16S rRNA gene sequences. Support values (percentage points) are indicated for 1,000 ultrafast bootstrap samples only for values that are less than 100. The root position was inferred from the global tree (c). Scale bar, 0.2 average nucleotide substitutions per site. c, Phylogenetic tree of bacteria, archaea and eukaryotes (inferred with IQ-tree under the LG + R10 model) constructed from the concatenated alignments of the protein sequences the correspond to 29 universally conserved genes, excluding COG0012 (Methods). The tree shows the relationships among the major clades. The tree is unrooted and is shown in a pseudorooted form for visualization purposes only. The arrowheads indicate 100 bootstrap support. DPANN, Diapherotrites, Parvarchaeota, Aenigmarchaeota, Nanoarchaeota and Nanohaloarchaeota. d, The consensus topology of 129 trees of bacteria, archaea and eukaryotes, constructed from the concatenated protein sequence alignments of bootstrap-like samples and leave-one-out sets of the of 29 universally conserved markers, excluding COG0012 (Methods). The tree shows the relationships between the major clades; tree branch lengths and support values are derived from the full 29-marker alignment; the arrowheads indicate 100 bootstrap support. The tree is unrooted and is shown in a pseudorooted form for visualization purposes only. The complete trees and alignments are in supplementary data file 2; lists of the trees are provided in Supplementary Tables 4, 5. Scale bars, 0.5 average amino acid substitutions per site (c, d).
Fig. 2 |. Domain architectures of selected ESPs in Asgard archaea.
a, ESPs with unique domain architecture. The schematics of multidomain proteins are roughly proportional to the respective protein lengths. The identified domains are shown as rectangles inside the arrows approximately according to their location. Homologous domains are shown by the same colour or pattern. For each schematic, protein identifier and lineage are indicated. b, DENN domain proteins in Asgard archaea. Above the line: putative operons encoding DENN domain proteins; below the line: domain architectures of diverse proteins containing DENN domain. Genes are shown by block arrows, roughly to scale. For each operon, the nucleotide contig identifier and coordinates are indicated. Homologous domains are colour-coded. Other designations are as in a. c, NPRL2-like proteins in Asgard archaea. Designations are as in b. Znr, zinc ribbon; HTH, helix-turn-helix domain; 7TM, seven transmembrane domain; Ig, immunoglobulin domain; Rec, receiver domain; PAS, Per-Arnt-Sim domain; MASE, membrane-associated sensor domain; -C, C-terminal domain.
Fig. 3 |. Reconstruction and evolution of key metabolic processes in Asgard archaea.
The schematic phylogeny of Asgard archaea is from Fig. 1a. LACA, last Asgard common ancestor; WLP, Wood–Ljungdahl pathway.
Similar articles
- Expanding Asgard members in the domain of Archaea sheds new light on the origin of eukaryotes.
Xie R, Wang Y, Huang D, Hou J, Li L, Hu H, Zhao X, Wang F. Xie R, et al. Sci China Life Sci. 2022 Apr;65(4):818-829. doi: 10.1007/s11427-021-1969-6. Epub 2021 Aug 6. Sci China Life Sci. 2022. PMID: 34378142 - Coevolution of Eukaryote-like Vps4 and ESCRT-III Subunits in the Asgard Archaea.
Lu Z, Fu T, Li T, Liu Y, Zhang S, Li J, Dai J, Koonin EV, Li G, Chu H, Li M. Lu Z, et al. mBio. 2020 May 19;11(3):e00417-20. doi: 10.1128/mBio.00417-20. mBio. 2020. PMID: 32430468 Free PMC article. - Asgard archaeal selenoproteome reveals a roadmap for the archaea-to-eukaryote transition of selenocysteine incorporation machinery.
Huang B, Xiao Y, Zhang Y. Huang B, et al. ISME J. 2024 Jan 8;18(1):wrae111. doi: 10.1093/ismejo/wrae111. ISME J. 2024. PMID: 38896033 Free PMC article. - Asgard archaea: Diversity, function, and evolutionary implications in a range of microbiomes.
MacLeod F, Kindler GS, Wong HL, Chen R, Burns BP. MacLeod F, et al. AIMS Microbiol. 2019 Jan 30;5(1):48-61. doi: 10.3934/microbiol.2019.1.48. eCollection 2019. AIMS Microbiol. 2019. PMID: 31384702 Free PMC article. Review. - Origin of eukaryotes from within archaea, archaeal eukaryome and bursts of gene gain: eukaryogenesis just made easier?
Koonin EV. Koonin EV. Philos Trans R Soc Lond B Biol Sci. 2015 Sep 26;370(1678):20140333. doi: 10.1098/rstb.2014.0333. Philos Trans R Soc Lond B Biol Sci. 2015. PMID: 26323764 Free PMC article. Review.
Cited by
- Cultivation of previously uncultured microorganisms with a continuous-flow down-flow hanging sponge (DHS) bioreactor, using a syntrophic archaeon culture obtained from deep marine sediment as a case study.
Imachi H, Nobu MK, Miyazaki M, Tasumi E, Saito Y, Sakai S, Ogawara M, Ohashi A, Takai K. Imachi H, et al. Nat Protoc. 2022 Dec;17(12):2784-2814. doi: 10.1038/s41596-022-00735-1. Epub 2022 Sep 14. Nat Protoc. 2022. PMID: 36104596 Review. - Navigating the archaeal frontier: insights and projections from bioinformatic pipelines.
Karavaeva V, Sousa FL. Karavaeva V, et al. Front Microbiol. 2024 Sep 23;15:1433224. doi: 10.3389/fmicb.2024.1433224. eCollection 2024. Front Microbiol. 2024. PMID: 39380680 Free PMC article. - Archaea: A Goldmine for Molecular Biologists and Evolutionists.
Forterre P. Forterre P. Methods Mol Biol. 2022;2522:1-21. doi: 10.1007/978-1-0716-2445-6_1. Methods Mol Biol. 2022. PMID: 36125740 - Evolution of optimal growth temperature in Asgard archaea inferred from the temperature dependence of GDP binding to EF-1A.
Lu Z, Xia R, Zhang S, Pan J, Liu Y, Wolf YI, Koonin EV, Li M. Lu Z, et al. Nat Commun. 2024 Jan 15;15(1):515. doi: 10.1038/s41467-024-44806-1. Nat Commun. 2024. PMID: 38225278 Free PMC article.
References
- Zaremba-Niedzwiedzka K et al. Asgard archaea illuminate the origin of eukaryotic cellular complexity. Nature 541, 353–358 (2017). - PubMed
- Cai M et al. Diverse Asgard archaea including the novel phylum Gerdarchaeota participate in organic matter degradation. Sci. China Life Sci 63, 886–897 (2020). - PubMed
Publication types
MeSH terms
LinkOut - more resources
Full Text Sources
Other Literature Sources


