In-Depth Evaluation of a Case of Presumed Myocarditis After the Second Dose of COVID-19 mRNA Vaccine - PubMed (original) (raw)
Case Reports
. 2021 Aug 10;144(6):487-498.
doi: 10.1161/CIRCULATIONAHA.121.056038. Epub 2021 Jun 16.
Madhusudhanan Narasimhan # 1, Quan-Zhen Li 2 3, Lenin Mahimainathan 1, Imran Hitto 1, Franklin Fuda 1, Kiran Batra 4, Xuan Jiang 3, Chengsong Zhu 3, John Schoggins 5, James B Cutrell 3, Carol L Croft 3, Amit Khera 3, Mark H Drazner 3, Justin L Grodin 3, Benjamin M Greenberg 6 7, Pradeep P A Mammen 3, Sean J Morrison 8 9, James A de Lemos 3
Affiliations
- PMID: 34133883
- PMCID: PMC8340727
- DOI: 10.1161/CIRCULATIONAHA.121.056038
Case Reports
In-Depth Evaluation of a Case of Presumed Myocarditis After the Second Dose of COVID-19 mRNA Vaccine
Alagarraju Muthukumar et al. Circulation. 2021.
Abstract
Supplemental Digital Content is available in the text.
Keywords: COVID-19; COVID-19 vaccine; myocarditis; vaccine.
Figures
Figure 1.
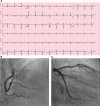
ECG and coronary angiogram. A, The ECG on presentation to the emergency department. B, A posterior anterior cranial projection of a dominant right coronary artery and with no severe angiographic stenoses or flow-limiting lesions in the main vessel or its branches. C, A right anterior oblique caudal projection of a bifurcating left coronary artery and no severe angiographic stenoses or flow-limiting lesions in the main vessel or its branches.
Figure 2.
Phase-sensitive inversion-recovery cardiac magnetic resonance imaging. Right, Short-axis views demonstrating linear and curvilinear delayed enhancement in the subepicardial inferior basal and mesocardial midventricular region, compatible with nonischemic pattern of delayed enhancement. Middle, A native T1 map showing globally increased T1 values (1054 ms), Local native myocardial T1 (short axis [SA] and 4 chamber [4CH] midwall) (965 ± 35) and specifically higher values in the regions of delayed enhancement. The color map shows relaxation times with normal relaxation time in green and increased relaxation time in red and orange. Left, Native T2 map with heterogenous relative increased T2 values within the same segments (arrows) (maximum T2 value was 65 ms) (local normal T2 values for our institution, 45–64 ms). Color scale shows time in milliseconds.
Figure 3.
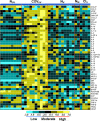
Antibody profile to viral antigens in the case of interest as compared with naive vaccinated, naive unvaccinated, and COVID-19 unvaccinated patients. The heatmap shows immunoglobulin G reactivity expressed in terms of row z-score for a respective antigen across different patient samples. Each antigen is organized into rows color-coded by virus, for serum specimens organized into columns classified as naive unvaccinated (NUV, 8 samples), (COVUV, 10 samples), naive vaccinated (NV, 10 samples), naive Moderna vaccinated controls (NM, 2 samples), and case of interest samples (CIS, collections at day 1, day 2, day 3, and day 4 after symptom onset: S1, S2, S3, and S4 in the respective order). Reactivity is represented by color (light blue=low, black=mid, ellow=high). The heatmap has normalized row z-score values, a typical scaling method that helps better visualization of analytes with varying trends in the expression/reactivity between samples. Although a normalized row z-score can better represent the nonrandomness of directionality within a dataset, a negative z-score does not indicate a complete absence of expression/reactivity. A negative z-score means comparatively a lower raw scores/absolute expression. CMV indicates cytomegalovirus; COVID-19, coronavirus disease 2019; EBV, Epstein-Barr virus; and RSV, respiratory syncytial virus.
Figure 4.
SARS-CoV-2–related antibody status in the case of interest as compared with naive vaccinated, naive unvaccinated, and COVID-19–unvaccinated patients. Comparison of SARS-CoV2–related antibody response in the case of interest with naive vaccinated, naive unvaccinated, and COVID unvaccinated patients. A, Evaluation of spike-specific IgG antibody response. B, Comparison of spike-specific IgM levels. C, Comparison of nucleocapsid-specific antibody response. For A through C, all the patient samples in the NV group were immunized with Pfizer vaccine. AU indicates arbitrary units; CIS2, case of interest sampled at day 2 after symptom onset; CIS4, case of interest sampled at day 4 after symptom onset; COVID-19, coronavirus disease 2019; COVUV, COVID-19 unvaccinated; Ig, immunoglobulin; NM, age- and vaccine (Moderna)–matched naive (positive controls for case of interest); NUV, naive unvaccinated; NV, naive vaccinated; SARS-CoV2, severe acute respiratory syndrome coronavirus 2; and SP, spike. Dashed brown line indicates the manufacturer-recommended positive threshold of the respective antibody assays used.
Figure 5.
Cytokine profile in the case of interest as compared with naive vaccinated, naive unvaccinated, and COVID-19–unvaccinated patients. The heatmap shows reactivity expressed in terms of row z-score for a respective antigen across different patient samples. Each row in the graphics represent a cytokine for serum specimens organized into columns classified as naive unvaccinated (NUV, 8 samples), COVID-19 unvaccinated (COVUV, 10 samples), naive vaccinated (NV, 10 samples), naive Moderna vaccinated controls (NM, 2 samples), and case of interest samples (CIS, 4 different collection days at day 1, day 2, day 3, and day 4 after symptom onset: S1, S2, S3, and S4 in the respective order). The reactivity intensity ranges from turquoise (low) to black (moderate) or yellow (high). For the groups NM and CIS, each patient sample was run in duplicates that were averaged and represented. Some of the samples that displayed values below the least detection range were arbitrarily assigned a lowest value. COVID-19 indicates coronavirus disease 2019.
Figure 6.
Antibody profiles to self-antigens in the case patient relative to unvaccinated naive and COVID-19 patient samples. The heatmap shows the Phenolyzer-prioritized candidate proteins involved in cardiac disease expressed in terms of mean of the individual signal intensities from the duplicate samples that were corrected for background intensity followed by variance stabilizing normalization (VSN). Each row in the graphics represent the analytes for serum specimens organized into columns classified as naive unvaccinated (NUV, 2 samples), COVID-19 unvaccinated (COVUV, 1 sample) and case of interest samples (CIS; day 1 sample after symptom onset). The reactivity intensity ranges from blue (low) to white (moderate) or red (high). Horizontal black lines segregate the subpanel cluster where autoantibodies are altered either commonly in both COVUV and CIS or only in COVUV or CIS relative to NUV. A, IgM-specific autoantibody changes. B, IgG-specific autoantibody changes. Abs indicates antibodies; COVID-19, coronavirus disease 2019; and Ig, immunoglobulin.
Similar articles
- Myocarditis After BNT162b2 and mRNA-1273 Vaccination.
Larson KF, Ammirati E, Adler ED, Cooper LT Jr, Hong KN, Saponara G, Couri D, Cereda A, Procopio A, Cavalotti C, Oliva F, Sanna T, Ciconte VA, Onyango G, Holmes DR, Borgeson DD. Larson KF, et al. Circulation. 2021 Aug 10;144(6):506-508. doi: 10.1161/CIRCULATIONAHA.121.055913. Epub 2021 Jun 16. Circulation. 2021. PMID: 34133884 Free PMC article. - Myocarditis Temporally Associated With COVID-19 Vaccination.
Rosner CM, Genovese L, Tehrani BN, Atkins M, Bakhshi H, Chaudhri S, Damluji AA, de Lemos JA, Desai SS, Emaminia A, Flanagan MC, Khera A, Maghsoudi A, Mekonnen G, Muthukumar A, Saeed IM, Sherwood MW, Sinha SS, O'Connor CM, deFilippi CR. Rosner CM, et al. Circulation. 2021 Aug 10;144(6):502-505. doi: 10.1161/CIRCULATIONAHA.121.055891. Epub 2021 Jun 16. Circulation. 2021. PMID: 34133885 Free PMC article. - Acute Myocarditis Following COVID-19 mRNA Vaccination in Adults Aged 18 Years or Older.
Simone A, Herald J, Chen A, Gulati N, Shen AY, Lewin B, Lee MS. Simone A, et al. JAMA Intern Med. 2021 Dec 1;181(12):1668-1670. doi: 10.1001/jamainternmed.2021.5511. JAMA Intern Med. 2021. PMID: 34605853 Free PMC article. - Myocarditis With COVID-19 mRNA Vaccines.
Bozkurt B, Kamat I, Hotez PJ. Bozkurt B, et al. Circulation. 2021 Aug 10;144(6):471-484. doi: 10.1161/CIRCULATIONAHA.121.056135. Epub 2021 Jul 20. Circulation. 2021. PMID: 34281357 Free PMC article. Review. - A review of the immunogenicity and safety of booster doses of omicron variant-containing mRNA-1273 COVID-19 vaccines in adults and children.
Priddy F, Chalkias S, Essink B, Whatley J, Brosz A, Lee IT, Feng J, Tracy L, Deng W, Zhou W, Zhou H, Dixit A, Schnyder-Ghamloush S, Girard B, de Windt E, Yeakey A, Miller J, Das R, Kuter BJ. Priddy F, et al. Expert Rev Vaccines. 2024 Jan-Dec;23(1):862-878. doi: 10.1080/14760584.2024.2397026. Epub 2024 Sep 9. Expert Rev Vaccines. 2024. PMID: 39234779 Review.
Cited by
- COVID-19 Vaccine-Induced Myocarditis: A Systemic Review and Literature Search.
Khan Z, Pabani UK, Gul A, Muhammad SA, Yousif Y, Abumedian M, Elmahdi O, Gupta A. Khan Z, et al. Cureus. 2022 Jul 28;14(7):e27408. doi: 10.7759/cureus.27408. eCollection 2022 Jul. Cureus. 2022. PMID: 36051715 Free PMC article. Review. - Myocarditis following mRNA Covid-19 vaccination: A pooled analysis.
Bellos I, Karageorgiou V, Viskin D. Bellos I, et al. Vaccine. 2022 Mar 15;40(12):1768-1774. doi: 10.1016/j.vaccine.2022.02.017. Epub 2022 Feb 7. Vaccine. 2022. PMID: 35153093 Free PMC article. - Evaluation of Autoantibody Binding to Cardiac Tissue in Multisystem Inflammatory Syndrome in Children and COVID-19 Vaccination-Induced Myocarditis.
Patel H, Sintou A, Chowdhury RA, Rothery S, Iacob AO, Prasad S, Rainer PP, Martinón-Torres F, Sancho-Shimizu V, Shimizu C, Dummer K, Tremoulet AH, Burns JC, Sattler S, Levin M; DIAMONDS consortium. Patel H, et al. JAMA Netw Open. 2023 May 1;6(5):e2314291. doi: 10.1001/jamanetworkopen.2023.14291. JAMA Netw Open. 2023. PMID: 37200028 Free PMC article. - The Role and Implications of COVID-19 in Incident and Prevalent Heart Failure.
Rico-Mesa JS, Haloot J, Anupama BK, Atluri S, Liu J, Khalid U. Rico-Mesa JS, et al. Curr Heart Fail Rep. 2024 Oct;21(5):485-497. doi: 10.1007/s11897-024-00677-7. Epub 2024 Jul 23. Curr Heart Fail Rep. 2024. PMID: 39042238 Review. - Transient severe myocarditis and intraventricular thrombus associated with SARS-CoV-2 vaccination.
Loch A, Siew KSW, Tan KL, Azman Bin Raja Aman RRAB. Loch A, et al. Singapore Med J. 2023 Jun;64(6):366-372. doi: 10.11622/smedj.2022042. Singapore Med J. 2023. PMID: 35509213 Free PMC article. No abstract available.
References
- Luetkens JA, Faron A, Isaak A, Dabir D, Kuetting D, Feisst A, Schmeel FC, Sprinkart AM, Thomas D. Comparison of original and 2018 Lake Louise criteria for diagnosis of acute myocarditis: results of a validation cohort. Radiol Cardiothorac Imaging. 2019;1:e190010. doi: 10.1148/ryct.2019190010 - PMC - PubMed
- Su JR, McNeil MM, Welsh KJ, Marquez PL, Ng C, Yan M, Cano MV. Myopericarditis after vaccination, Vaccine Adverse Event Reporting System (VAERS), 1990-2018. Vaccine. 2021;39:839–845. doi: 10.1016/j.vaccine.2020.12.046 - PubMed
- Ader F, Surget E, Charron P, Redheuil A, Zouaghi A, Maltret A, Marijon E, Denjoy I, Hermida A, Fressart V, et al. . Inherited cardiomyopathies revealed by clinically suspected myocarditis: highlights from genetic testing. Circ Genom Precis Med. 2020;13:e002744. doi: 10.1161/CIRCGEN.119.002744 - PubMed
Publication types
MeSH terms
Substances
LinkOut - more resources
Full Text Sources
Medical


