Few-shot learning creates predictive models of drug response that translate from high-throughput screens to individual patients - PubMed (original) (raw)
Few-shot learning creates predictive models of drug response that translate from high-throughput screens to individual patients
Jianzhu Ma et al. Nat Cancer. 2021 Feb.
Abstract
Cell-line screens create expansive datasets for learning predictive markers of drug response, but these models do not readily translate to the clinic with its diverse contexts and limited data. In the present study, we apply a recently developed technique, few-shot machine learning, to train a versatile neural network model in cell lines that can be tuned to new contexts using few additional samples. The model quickly adapts when switching among different tissue types and in moving from cell-line models to clinical contexts, including patient-derived tumor cells and patient-derived xenografts. It can also be interpreted to identify the molecular features most important to a drug response, highlighting critical roles for RB1 and SMAD4 in the response to CDK inhibition and RNF8 and CHD4 in the response to ATM inhibition. The few-shot learning framework provides a bridge from the many samples surveyed in high-throughput screens (_n_-of-many) to the distinctive contexts of individual patients (_n_-of-one).
Figures
Extended Data Fig. 1 |. Analysis of fitness versus predictive performance for the panel of gene knockouts in our study.
a, Distribution of relative growth values after CRISPR gene knockout, median for all n = 341 cell lines. Blue: pooling knockouts of all n = 17670 genes; Pink: pooling n = 469 knockouts of genes selected in our study. Fitness is corrected by the Copy Number Variation by the CERES algorithm. b, For each knockout of a selected gene, predictive performance (y axis) is computed as the Pearson correlation between predicted and actual growth measurements over all n = 341 cell lines. This performance is displayed as a function of the median growth fitness of that knockout (x axis). Growth fitness is binned according to percentiles, for example the first bin (0–10%) represents the top 10% of selected genes with the strongest median effects on growth. The distribution of predictive performance for each bin is shown with a violin plot. Error bars represent 95% confidence interval.
Extended Data Fig. 2 |
Training accuracy of TCRP and other baseline models for all challenges.
Extended Data Fig. 3 |. Alternative calculation of model performance using Spearman correlation.
While Pearson correlation is used to calculate model performance in the main text, this supplemental figure provides equivalent performance calculations using the non-parametric rank-based Spearman correlation. a, Related to Fig. 3b on n = 83 PDTC models. b, Related to Fig. 4a on n = 228 PDX models.
Extended Data Fig. 4 |. Comparison of transferability of different machine learning models to patient-derived xenografts.
Predictive models were pre-trained using responses of cancer cell lines to perturbations with drugs, one model per drug. Few-shot learning was then performed on 0–10 PDX breast tumor samples exposed to that drug (x-axis), and model accuracy (y-axis) was measured by a, Pearson correlation or b, Spearman correlation on the remaining held-out PDX samples. Results averaged across five drugs (see main text). This experiment considers n = 228 PDX models.
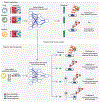
Extended Data Fig. 5 |. Interpreting the TCRP model with the framework of Local Interpretable Model-Agnostic explanations (LIMe).
See Methods.
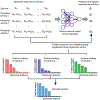
Fig. 1 |. Study design.
Three distinct translation challenges are considered. Each challenge involves a pretraining phase (top) based on cell-line response data across tissues, followed by a few-shot learning phase (bottom) in which data in the new context are presented for additional learning, one sample at a time. Challenge 1: transfer of CRISPR (challenge 1a) or drug (challenge 1b) response model for prediction in the context of a new tissue. Challenge 2: transfer of model to PDTCs in vitro. Challenge 3: transfer of model to PDXs in vivo.
Fig. 2 |. Transfer of predictive models across tissue types.
a, Challenge 1a. For each CRISPR gene knockout and target tissue, model accuracy is measured by Pearson’s correlation between predicted and actual drug responses, considering only the test samples from the target. The plot shows the average model accuracy across CRISPR knockouts (y axis, mean ± 95% confidence interval (CI)) as a function of the number of cell lines (from n = 0 cell lines to n = 10 cell lines) from the target tissue provided to the model during training (x axis), considering in total n = 335 cell lines with n = 469 gene disruptions. b, Model accuracy (x axis) is displayed separately for each tissue in challenge 1a (y axis). Accuracy is the average achieved when training includes five to ten samples of the target tissue. The accuracy s.d. is shown over all CRISPR gene knockouts (point size). c, As for a for models trained on perturbations with n = 199 targeted drugs and n = 1,001 cell lines. d, As for b for models trained on perturbations with targeted drugs.
Fig. 3 |. Transfer of cell-line models to PDTC lines.
a, Schema for translating a predictive model from cell lines to patients using few-shot learning. The model is trained over successive rounds of data, each with fewer samples but closer to the desired clinical context. b, Challenge 2. Predictive models were pretrained using responses of breast cancer cell lines to targeted perturbations with a particular drug (Table 1). Few-shot learning was then performed on 0–10 PDTC breast tumor samples exposed to that drug (x axis), and model accuracy (Pearson’s correlation, y axis, mean ± 95% CI) validated using the remaining held-out PDTC samples. Results averaged across 48 drugs on n = 83 PDTC models. c, Predictive accuracy (x axis) is displayed separately for each drug model (y axis, mean ± 95% CI) on n = 83 PDTC models. Colors as in previous figures.
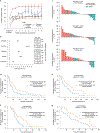
Fig. 4 |. Transfer of cell-line models to PDXs.
a, Challenge 3. Predictive models were pretrained using responses of cancer cell lines to targeted perturbations with drugs, one model per drug. Few-shot learning (x axis, number of few-shot samples used) was performed using PDX samples exposed to one of five drugs (line colors), and the improved model used to predict the change in tumor volume (Δvol; Methods). Accuracy of this prediction was validated using the actual changes in volume of the remaining held-out PDXs (Pearson’s correlation, y axis, mean ± 95% CI). This experiment included in total n = 228 PDX models. b, Odds ratio. We evaluated the odds of obtaining SD:PD outcomes when stratifying tumors into predicted responsive versus unresponsive subtypes (predicted Δvol < or ≥30%, respectively). Odds ratio (left) and corresponding contingency table (right), are shown for each drug (n = 31 samples for trametinib, n = 37 for tamoxifen, n = 51 for paclitaxel, n = 21 for erlotinib and n = 60 for cetuximab). Error bar represents mean ± 95% CI. c, Ranking of all PDX samples (x axis) by the predicted Δvol (y axis) for trametinib, paclitaxel and erlotinib. Color indicates actual clinical outcome. The rank P value is calculated by using a one-sided Wilcoxon’s Mann–Whitney _U_-test (n = 31 samples for trametinib, n = 51 for paclitaxel and n = 20 for erlotinib). d–g, Kaplan–Meier survival plots when stratifying tumors into responsive versus unresponsive subtypes for cetuximab (d) on n = 65 PDX models, paclitaxel (e) on n = 57 PDX samples, tamoxifen (f) on n = 36 PDX samples and trametinib (g) on n = 35 PDX samples. The log(rank P value) is calculated using a two-sided χ test.
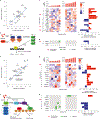
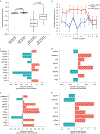
Fig. 5 |. Model interpretation to identify predictive markers.
a, Measured versus predicted resistance to the CDK4/6 inhibitor palbociclib after few-shot learning on five PDTC samples treated with this drug on n = 19 test PDTC models. The error bars indicate the minimum/maximum value of the predictions across ten randomizations. b, Schematic of CDK pathway with palbociclib targets and selected molecular markers. c, Left: mRNA expression profiles for the top expression-based features of palbociclib. Right: Pearson’s correlation of palbociclib resistance and mRNA expression for the top expression-based features. d, Left: somatic mutation profiles for the top mutation-based features of palbociclib. Right: increase of palbociclib resistance when comparing mutated and wild-type samples for each top feature. e, Same as a for the response to ATM inhibitor KU-55933 on n = 19 PDTC models. f, Schematic of ATM pathway with selected predictive markers. g,h, Same as c and d for the response to ATM inhibitor KU-55933. Numbered sample labels in a and e correspond to PDTC sample numbers in c,d,g and h, in which molecular profiles for the six most sensitive and six most resistant samples are shown (PDTC1-6 and PDTC14-19, respectively) within n = 19 PDTC models.
Fig. 6 |. Model predictions and interpretation for the BRAF inhibitor dabrafenib.
a, Box plots of predicted dabrafenib response for n = 39 CRC and n = 42 melanoma cell lines with respect to BRAF mutation status. The rank P value is calculated by using a one-sided Wilcoxon’s Mann–Whitney _U_-test on a total of n = 81 cell lines. The error bar represents mean ± 95% CI. b, Prediction accuracy of the TCRP model for CRC and melanoma cell lines used for a. Accuracy (y axis) is shown as a function of additional training samples used for few-shot learning (x axis). Accuracy mean and s.d. calculated over ten random samples of cell lines selected from n = 39 CRC and n = 42 melanoma cell lines used for training. c, Pearson’s correlation of dabrafenib response (AUC) and mRNA expression for the top expression-based features for CRC (ranked in decreasing importance from top to bottom; Methods). d, Relative change in dabrafenib response (AUC) on somatic mutation of each of the top mutation-based features for CRC (ranked in decreasing importance from top to bottom; Methods). e, Similar to c for melanoma. f, Similar to d for melanoma.
Similar articles
- Few-Shot Learning for Low-Data Drug Discovery.
Vella D, Ebejer JP. Vella D, et al. J Chem Inf Model. 2023 Jan 9;63(1):27-42. doi: 10.1021/acs.jcim.2c00779. Epub 2022 Nov 21. J Chem Inf Model. 2023. PMID: 36410391 - Transfer learning with convolutional neural networks for cancer survival prediction using gene-expression data.
López-García G, Jerez JM, Franco L, Veredas FJ. López-García G, et al. PLoS One. 2020 Mar 26;15(3):e0230536. doi: 10.1371/journal.pone.0230536. eCollection 2020. PLoS One. 2020. PMID: 32214348 Free PMC article. - Learning personalized ADL recognition models from few raw data.
Compagnon P, Lefebvre G, Duffner S, Garcia C. Compagnon P, et al. Artif Intell Med. 2020 Jul;107:101916. doi: 10.1016/j.artmed.2020.101916. Epub 2020 Jun 27. Artif Intell Med. 2020. PMID: 32828455 - Advancements within Modern Machine Learning Methodology: Impacts and Prospects in Biomarker Discovery.
Ledesma D, Symes S, Richards S. Ledesma D, et al. Curr Med Chem. 2021;28(32):6512-6531. doi: 10.2174/0929867328666210208111821. Curr Med Chem. 2021. PMID: 33557728 Review. - A guide to machine learning for biologists.
Greener JG, Kandathil SM, Moffat L, Jones DT. Greener JG, et al. Nat Rev Mol Cell Biol. 2022 Jan;23(1):40-55. doi: 10.1038/s41580-021-00407-0. Epub 2021 Sep 13. Nat Rev Mol Cell Biol. 2022. PMID: 34518686 Review.
Cited by
- Predicting and characterizing a cancer dependency map of tumors with deep learning.
Chiu YC, Zheng S, Wang LJ, Iskra BS, Rao MK, Houghton PJ, Huang Y, Chen Y. Chiu YC, et al. Sci Adv. 2021 Aug 20;7(34):eabh1275. doi: 10.1126/sciadv.abh1275. Print 2021 Aug. Sci Adv. 2021. PMID: 34417181 Free PMC article. - Patient-derived xenograft models in cancer therapy: technologies and applications.
Liu Y, Wu W, Cai C, Zhang H, Shen H, Han Y. Liu Y, et al. Signal Transduct Target Ther. 2023 Apr 12;8(1):160. doi: 10.1038/s41392-023-01419-2. Signal Transduct Target Ther. 2023. PMID: 37045827 Free PMC article. Review. - Artificial intelligence in food and nutrition evidence: The challenges and opportunities.
Bailey RL, MacFarlane AJ, Field MS, Tagkopoulos I, Baranzini SE, Edwards KM, Rose CJ, Schork NJ, Singhal A, Wallace BC, Fisher KP, Markakis K, Stover PJ. Bailey RL, et al. PNAS Nexus. 2024 Oct 15;3(12):pgae461. doi: 10.1093/pnasnexus/pgae461. eCollection 2024 Dec. PNAS Nexus. 2024. PMID: 39677367 Free PMC article. - Spectroscopy-Guided Deep Learning Predicts Solid-Liquid Surface Adsorbate Properties in Unseen Solvents.
Du W, Ma F, Zhang B, Zhang J, Wu D, Sharman E, Jiang J, Wang Y. Du W, et al. J Am Chem Soc. 2024 Jan 10;146(1):811-823. doi: 10.1021/jacs.3c10921. Epub 2023 Dec 29. J Am Chem Soc. 2024. PMID: 38157302 Free PMC article. - Cell Maps for Artificial Intelligence: AI-Ready Maps of Human Cell Architecture from Disease-Relevant Cell Lines.
Clark T, Mohan J, Schaffer L, Obernier K, Al Manir S, Churas CP, Dailamy A, Doctor Y, Forget A, Hansen JN, Hu M, Lenkiewicz J, Levinson MA, Marquez C, Nourreddine S, Niestroy J, Pratt D, Qian G, Thaker S, Bélisle-Pipon JC, Brandt C, Chen J, Ding Y, Fodeh S, Krogan N, Lundberg E, Mali P, Payne-Foster P, Ratcliffe S, Ravitsky V, Sali A, Schulz W, Ideker T. Clark T, et al. bioRxiv [Preprint]. 2024 May 24:2024.05.21.589311. doi: 10.1101/2024.05.21.589311. bioRxiv. 2024. PMID: 38826258 Free PMC article. Preprint.
References
- Brabetz S et al. A biobank of patient-derived pediatric brain tumor models. Nat. Med 24, 1752–1761 (2018). - PubMed
- Butler D Translational research: crossing the valley of death. Nature 453, 840–842 (2008). - PubMed
Publication types
MeSH terms
Substances
Grants and funding
- P41 GM103504/GM/NIGMS NIH HHS/United States
- K22 CA234406/CA/NCI NIH HHS/United States
- R01 HG009979/HG/NHGRI NIH HHS/United States
- U54 CA209891/CA/NCI NIH HHS/United States
- R01 CA236367/CA/NCI NIH HHS/United States
- R01 CA204173/CA/NCI NIH HHS/United States
LinkOut - more resources
Full Text Sources
Research Materials
Miscellaneous


