Control of gasdermin D oligomerization and pyroptosis by the Ragulator-Rag-mTORC1 pathway - PubMed (original) (raw)
Control of gasdermin D oligomerization and pyroptosis by the Ragulator-Rag-mTORC1 pathway
Charles L Evavold et al. Cell. 2021.
Abstract
The process of pyroptosis is mediated by inflammasomes and a downstream effector known as gasdermin D (GSDMD). Upon cleavage by inflammasome-associated caspases, the N-terminal domain of GSDMD forms membrane pores that promote cytolysis. Numerous proteins promote GSDMD cleavage, but none are known to be required for pore formation after GSDMD cleavage. Herein, we report a forward genetic screen that identified the Ragulator-Rag complex as being necessary for GSDMD pore formation and pyroptosis in macrophages. Mechanistic analysis revealed that Ragulator-Rag is not required for GSDMD cleavage upon inflammasome activation but rather promotes GSDMD oligomerization in the plasma membrane. Defects in GSDMD oligomerization and pore formation can be rescued by mitochondrial poisons that stimulate reactive oxygen species (ROS) production, and ROS modulation impacts the ability of inflammasome pathways to promote pore formation downstream of GSDMD cleavage. These findings reveal an unexpected link between key regulators of immunity (inflammasome-GSDMD) and metabolism (Ragulator-Rag).
Keywords: gasdermin D; inflammasomes; inflammation; innate immunity; macrophages; mtorc1; pyroptosis; ragulator; reactive oxygen species.
Copyright © 2021 Elsevier Inc. All rights reserved.
Conflict of interest statement
Declaration of interests J.C.K. holds equity and consults for IFM Therapeutics and Corner Therapeutics. None of these relationships influenced the work performed in this study. J.G.D. consults for Microsoft Research, Agios, Phenomic AI, Maze Therapeutics, BioNTech, and Pfizer; J.G.D. consults for and has equity in Tango Therapeutics. J.G.D.’s interests were reviewed and are managed by the Broad Institute in accordance with its conflict-of-interest policies.
Figures
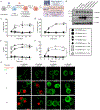
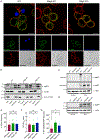
Figure 1.. Engineered macrophages model pyroptosis through expression of the GSDMD N-terminal domain
(A) Retroviral transduction workflow to generate Tet3G transactivator expressing Dox-inducible fluorescently tagged variants of GSDMD in iBMDMs from the Cas9 knock-in mouse and downstream characterization. (B) Western blot of stable Cas9 expression in parental and progeny iBMDMs and stable expression of Tet3G transactivator in progeny iBMDM clones with β-actin loading control. (C) Kinetic analysis of PI uptake by plate reader to measure bulk membrane permeability in populations of uninduced or Dox-induced (0.5 μg/ml) cells expressing NT-GSDMD-BFP or FL-GSDMD-BFP. (D) Time course end point analysis of LDH release into cell free supernatants to measure cell lysis in populations of uninduced or Dox-induced (0.5 μg/ml) cells expressing NT-GSDMD-BFP or FL-GSDMD-BFP. (E, F) Time course end point analysis by flow cytometry of the frequency of BFP+ (E) or PI+ cells (F) using uninduced or Dox-induced (0.5 μg/ml) cells expressing NT-GSDMD-BFP or FL-GSDMD-BFP. (G) Time course live cell imaging of Dox-induced cells expressing NT-GSDMD-BFP or FL-GSDMD-BFP noting localization of BFP signal and PI uptake. Scale bar indicates 10 μm. All quantification represents the mean and SEM of three independent experiments. Two-way ANOVA was used for analysis. See also Figure S1.
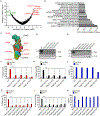
Figure 2.. Analysis of survivor cells sgRNA enrichment and validation of screen hits
(A) Hypergeometric analysis of log-normalized guide abundance of survivor cells subtracted by the log-normalized abundance of input cells plotted as gene level average p-value versus gene level average LFC. (B) Gene ontology functional annotation enrichment analysis for ranked hit list using GOrilla web analysis tool. (C) Cryo-EM structure of the Ragulator-Rag complex cartoon schematic with top hits identified from CRISPR screen highlighted in red. (D, E) Western blot of RagC (D) or RagA (E) protein ablation comparing empty vector transduced or cells expressing sgRNA guides targeting RagC and RagA. (F, G) PI uptake analysis of cells of the genotypes indicated, left uninduced or Dox-induced (2 μg/ml) for 16 hours. (H, I) LDH release from cells of the genotypes indicated, left uninduced or Dox-induced (2 μg/ml) for 16 hours. (J, K) Frequency of BFP+ cells by flow cytometry of cells of the genotypes indicated, left uninduced or Dox-induced (2 μg/ml) for 16 hours. All quantification represents the mean and SEM of three independent experiments. Two-way ANOVA was used for analysis. See also Figure S2.
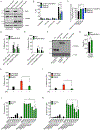
Figure 3.. The role of Ragulator-Rag and mTOR activity in NT-GSDMD pore formation
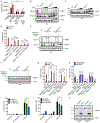
(A) Western blot of RagA and GSDMD cleavage in WT control untargeted and RagA targeted primary BMDMs after 1 hour of FlaTox treatment with β-actin loading control. (B) Frequency of PI+ cells by flow cytometry of WT and RagA targeted primary BMDMs after 1 hour of FlaTox treatment. (C) Ratio of depletion of Vex+, CD11b high splenocytes after 1 hour FlaTox treatment over LFn-Fla alone treatment. (D, E) WT and RagA/B DKO 293T cells were transfected with plasmids encoding hGSDMD variants and normalized PI fluorescence (D) and cell-free supernatant LDH activity (E) were analyzed 20 hours after transfection. (F) Western blot of hGSDMD variants in transfected WT and RagA/B DKO 293T cells. (G) MyD88 L265P-driven NF-κB reporter activity in WT and RagA/B DKO 293T cells by dual-luciferase system 24 hours after transfection. Response of MyD88 L265P transfected cells over empty vector transfected cells is shown. (H, I) Dox-inducible NT-GSDMD-BFP macrophages were treated with MHY1485 (10 μM) and Dox (0.5 μg/ml). Normalized PI fluorescence (H) and LDH activity in supernatants (I) were measured 6 hours later. (J, K) Dox-inducible NT-GSDMD-BFP macrophages were treated with different compounds and Dox (0.5 μg/ml). DMSO dose corresponds to DMSO content present in 2 μM Torin-1 samples. Normalized PI fluorescence (J) and extracellular LDH activity (K) were measured 14 hours later. Blots (A, F) are representative of two independent experiments. Means and SEM of three (B, C, D, E, G, J, K) or four (H, I) independent experiments are shown. Unpaired two-tailed t-test was used for pairwise comparison (D, E, G, H, I). One-way ANOVA (C) and two-way ANOVA (B, J, K) were used for analysis. See also Figure S3.
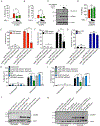
Figure 4.. mTORC1 acts downstream of GSDMD cleavage to promote pore formation and pyroptosis
(A–C) HEK293 cells were co-transfected with plasmids encoding hNT-GSDMD (I104N) and TSC-1. Normalized PI fluorescence (A), extracellular LDH activity (B) and protein abundance (C) were measured 20 hours post-transfection. (D) MyD88 L265P-driven NF-κB dual-luciferase system response in HEK293 cells transfected with TSC-1 24 hours after transfection. Response of MyD88 L265P transfected cells over empty vector transfected cells is shown. (E, F) PI uptake (E) and LDH release assessment (F) of LysM-CRE WT, Rictor-deficient, and Raptor-deficient iBMDMs, primed with recombinant IFNβ for 3 hours then electroporated with PBS or LPS. (G) Frequency of Annexin-V and 7-AAD positive cells by flow cytometry from LysM-CRE WT, Rictor-deficient, and Raptor-deficient iBMDMs after 8 hours of 1 μM Staurosporine (STS) treatment. (H, I) PI uptake (H) and LDH release (I) from LysM-CRE WT, Rictor-deficient, Raptor-deficient, C57/BL6J WT, NLRP3-deficient, and GSDMD-deficient iBMDMs, unstimulated or infected with S. Typhimurium at an MOI of 10 for 1 hour. (J) Western blot of the proteins indicated in LysM-CRE WT, Rictor-deficient, and Raptor-deficient iBMDMs, after these cells were primed with IFNβ and then electroporated with PBS or LPS. (K) Western blot of the proteins indicated in LysM-CRE WT, Rictor-deficient, Raptor-deficient, C57/BL6J WT, NLRP3-deficient, and GSDMD-deficient iBMDMs, after these cells were unstimulated or infected with S. Typhimurium at an MOI of 10 for 1 hour. All quantifications represent mean and SEM of 3 independent experiments. Two-way ANOVA was used for analysis. See also Figure S4.
Figure 5.. RagA or RagC are not required for NT-GSDMD plasma membrane localization, but are required for oligomerization and pore formation
(A) Confocal microscopy of NT-GSDMD-BFP (green) at 8 hours post Dox-induction (0.5 μg/ml) in WT, RagA KO, and RagC KO cells. Plasma membrane was labeled with CTB-AF647 (red) and membrane permeability was assessed by PI (blue). Scale bar indicates 10 μm. (B) Western blot of NT-GSDMD-BFP from post-nuclear input, cytosolic, and bulk membrane fractions of WT, RagA KO, and RagC KO cells, after Dox-induction (2 μg/ml) for 8 hours. Tubulin represents a cytosol marker and Na+/K+ ATPase represents a membrane marker. (C, D) Western blot of NT-GSDMD-BFP from combined cell lysate and supernatant under non-reducing conditions (C) or reducing conditions (D) from WT, RagA KO, and RagC KO cells after Dox-induction for 16 hours. (E) FRAP proportion of fluorescence recovery of CD14 labeled with PE-conjugated anti-CD14 antibody in WT, RagA KO, and RagC KO macrophages. (F) FRAP half-life of fluorescence recovery of CD14 labled with PE-conjugated anti-CD14 antibody in WT, RagA KO, and RagC KO macrophages. (G) FRAP proportion of fluorescence recovery of BFP signal from NT-GSDMD-BFP in WT, RagA KO, and RagC KO macrophages after Dox-induction (2 μg/ml) for 8 hours. Each data point (E, F, G) represents parameters from a fitted FRAP curve from individual cells (n ≥ 24). One-way ANOVA was used for analysis.
Figure 6.. Mitochondrial dysfunction and ROS mediate GSDMD oligomerization
(A) Intracellular ROS levels in live cells of the genotypes indicated by CellRox Deep Red fluorescence after Dox induction (0.5 μg/ml) for 8 hours. (B, C) Western blot of the proteins indicated from combined cell lysates and supernatants under non-reducing (B) or reducing (C) conditions from from WT, RagA KO, and RagC KO cells after Dox induction for 8 hours and treated with increasing concentrations of H2O2 for the last 4 hours. (D) PI uptake by WT, RagA KO, and RagC KO cells after Dox induction for 8 hours and treated with 625 μM of H2O2 for the last 4 hours. MCC950 (10 μM) was added to cells at the start of Dox induction. (E, F) Western blot of NT-GSDMD-BFP from combined cell lysates and supernatants under non-reducing (E) or reducing (F) conditions from WT, RagA KO, and RagC KO cells after Dox induction for 8 hours and treated with Antimycin A (10 μg/ml), Rotenone (10 μM) or TTFA (100 μM) for the last 4 hours. (G) PI uptake by WT, RagA KO, and RagC KO cells after Dox induction for 8 hours and treated with Antimycin A (10 μg/ml), Rotenone (10 μM) or TTFA (100 μM) for the last 4 hours. (H) PI uptake by MCC950-treated cells of the genotypes indicated after Dox induction for 8 hours and treated with Antimycin A (10 μg/ml), Rotenone (10 μM) or TTFA (100 μM) for the last 4 hours. (I, J) PI uptake (I) and LDH release into cell-free supernatant (J) from WT iBMDMs treated with FlaTox and indicated concentrations of NAC for 2 hours. (K) Western blot of the proteins indicated from combined cell lysates and supernatants from WT iBMDMs treated with FlaTox and 15 mM NAC for 2 hours. Means and SEM of three (A, D, G, H, J) or four (I) independent experiments are shown. Two-way ANOVA was used for analysis. See also Figures S5 and S6.
Comment in
- Partners with a killer: Metabolic signaling promotes inflammatory cell death.
Liu Z, Xiao TS. Liu Z, et al. Cell. 2021 Aug 19;184(17):4374-4376. doi: 10.1016/j.cell.2021.07.036. Cell. 2021. PMID: 34416144 Free PMC article.
Similar articles
- Ragulator-Rag and ROS TORment gasdermin D pore formation.
Magupalli VG, Fontana P, Wu H. Magupalli VG, et al. Trends Immunol. 2021 Nov;42(11):948-950. doi: 10.1016/j.it.2021.09.014. Epub 2021 Oct 15. Trends Immunol. 2021. PMID: 34663551 Free PMC article. - Gasdermin D pore-forming activity is redox-sensitive.
Devant P, Boršić E, Ngwa EM, Xiao H, Chouchani ET, Thiagarajah JR, Hafner-Bratkovič I, Evavold CL, Kagan JC. Devant P, et al. Cell Rep. 2023 Jan 31;42(1):112008. doi: 10.1016/j.celrep.2023.112008. Epub 2023 Jan 19. Cell Rep. 2023. PMID: 36662620 Free PMC article. - Mitochondrial ROS promote macrophage pyroptosis by inducing GSDMD oxidation.
Wang Y, Shi P, Chen Q, Huang Z, Zou D, Zhang J, Gao X, Lin Z. Wang Y, et al. J Mol Cell Biol. 2019 Dec 19;11(12):1069-1082. doi: 10.1093/jmcb/mjz020. J Mol Cell Biol. 2019. PMID: 30860577 Free PMC article. - New insights into Gasdermin D pore formation.
Kappelhoff S, Margheritis EG, Cosentino K. Kappelhoff S, et al. Biochem Soc Trans. 2024 Apr 24;52(2):681-692. doi: 10.1042/BST20230549. Biochem Soc Trans. 2024. PMID: 38497302 Review. - The Regulation and Modification of GSDMD Signaling in Diseases.
Li Z, Ji S, Jiang ML, Xu Y, Zhang CJ. Li Z, et al. Front Immunol. 2022 Jun 14;13:893912. doi: 10.3389/fimmu.2022.893912. eCollection 2022. Front Immunol. 2022. PMID: 35774778 Free PMC article. Review.
Cited by
- Updated insights into the NLRP3 inflammasome in postoperative cognitive dysfunction: emerging mechanisms and treatments.
Wang T, Sun G, Tao B. Wang T, et al. Front Aging Neurosci. 2024 Sep 30;16:1480502. doi: 10.3389/fnagi.2024.1480502. eCollection 2024. Front Aging Neurosci. 2024. PMID: 39411285 Free PMC article. Review. - Blockade of mTORC1 via Rapamycin Suppresses 27-Hydroxycholestrol-Induced Inflammatory Responses.
Kang N, Kim J, Kwon M, Son Y, Eo SK, Baryawno N, Kim BS, Yoon S, Oh SO, Lee D, Kim K. Kang N, et al. Int J Mol Sci. 2024 Sep 26;25(19):10381. doi: 10.3390/ijms251910381. Int J Mol Sci. 2024. PMID: 39408711 Free PMC article. - Lithocarpus polystachyus Rehd. ameliorates cerebral ischemia/reperfusion injury through inhibiting PI3K/AKT/NF-κB pathway and regulating NLRP3-mediated pyroptosis.
Liu D, Wu W, Wang T, Zhan G, Zhang Y, Gao J, Gong Q. Liu D, et al. Front Pharmacol. 2024 Sep 24;15:1365642. doi: 10.3389/fphar.2024.1365642. eCollection 2024. Front Pharmacol. 2024. PMID: 39380903 Free PMC article. - Antagonistic nanobodies implicate mechanism of GSDMD pore formation and potential therapeutic application.
Schiffelers LDJ, Tesfamariam YM, Jenster LM, Diehl S, Binder SC, Normann S, Mayr J, Pritzl S, Hagelauer E, Kopp A, Alon A, Geyer M, Ploegh HL, Schmidt FI. Schiffelers LDJ, et al. Nat Commun. 2024 Sep 26;15(1):8266. doi: 10.1038/s41467-024-52110-1. Nat Commun. 2024. PMID: 39327452 Free PMC article. - Proximity labeling defines the phagosome lumen proteome of murine and primary human macrophages.
Allsup BL, Gharpure S, Bryson BD. Allsup BL, et al. bioRxiv [Preprint]. 2024 Sep 8:2024.09.04.611277. doi: 10.1101/2024.09.04.611277. bioRxiv. 2024. PMID: 39282337 Free PMC article. Preprint.
References
Publication types
MeSH terms
Substances
Grants and funding
- R01 AI093589/AI/NIAID NIH HHS/United States
- R56 AI093589/AI/NIAID NIH HHS/United States
- R35 GM142683/GM/NIGMS NIH HHS/United States
- R03 DK125630/DK/NIDDK NIH HHS/United States
- R37 AI116550/AI/NIAID NIH HHS/United States
- U19 AI133524/AI/NIAID NIH HHS/United States
- F31 AI138369/AI/NIAID NIH HHS/United States
- R01 AI116550/AI/NIAID NIH HHS/United States
- P30 DK034854/DK/NIDDK NIH HHS/United States
- K08 DK113106/DK/NIDDK NIH HHS/United States
LinkOut - more resources
Full Text Sources
Other Literature Sources
Molecular Biology Databases
Research Materials
