Sclerostin antibody improves phosphate metabolism hormones, bone formation rates, and bone mass in adult Hyp mice - PubMed (original) (raw)
Sclerostin antibody improves phosphate metabolism hormones, bone formation rates, and bone mass in adult Hyp mice
Kelsey A Carpenter et al. Bone. 2022 Jan.
Abstract
X-linked hypophosphatemia (XLH) is caused by a loss-of-function mutation in the phosphate regulating gene with homology to endopeptidase located on the X chromosome (PHEX). Loss of functional PHEX results in elevated fibroblast growth factor 23 (FGF23), impaired phosphate reabsorption, and inhibited skeletal mineralization. Sclerostin, a protein produced primarily by osteocytes, suppresses bone formation by antagonizing canonical Wnt-signaling and is reported to be elevated in XLH patients. Our previous study reported that a monoclonal antibody to sclerostin (Scl-Ab) decreases FGF23 and increases phosphate and bone mass in growing Hyp mice (XLH murine model). In the current study, we investigated the efficacy of Scl-Ab in treating XLH pathophysiology in adult Hyp mice that are past the period of rapid skeletal growth (12 and 20-weeks old). We hypothesized that Scl-Ab would not only increase bone formation, bone strength and bone mass, but would also normalize phosphate regulating hormones, FGF23, parathyroid hormone (PTH), and vitamin 1,25(OH)2D. Scl-Ab treatment increased cortical area, trabecular bone volume fraction, trabecular bone formation rate, and the bending moment in both sexes of both age groups. Scl-Ab treatment suppressed circulating levels of intact FGF23 and c-term FGF23 in treated male and female wild-type and Hyp mice of both age groups and improved both vitamin 1,25(OH)2D and PTH. Scl-Ab treated Hyp mice also showed evidence of increased renal expression of the sodium-phosphate co-transporter, NPT2a, specifically in the female Hyp mice. Our study suggests that Scl-Ab treatment can improve several skeletal and metabolic pathologies associated with XLH, further establishes the role of sclerostin in the regulation of FGF23 and provides evidence that Scl-Ab can improve phosphate regulation by targeting the bone-renal axis.
Keywords: FGF23; Mineral metabolism; Sclerostin; XLH.
Copyright © 2021 Elsevier Inc. All rights reserved.
Figures
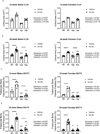
Figure 1.
Mineral metabolism markers for 12-week-old male and female mice; intact FGF23 (A), c-term FGF23 (B), phosphate (C), calcium (D), 1,25(OH)2D (E), and PTH (F). Data are presented as the mean ± standard deviation. Results from the two-way ANOVA are presented in the figure legends. Significant post-hoc differences are reported above the data, with horizontal bars highlighting significant treatment differences between animals of the same genotype and letters highlighting significant differences between Hyp mice and vehicle treated WTs (a) and Scl-Ab treated WTs (b).
Figure 2.
Mineral metabolism markers for 20-week-old male and female mice; intact FGF23 (A), c-term FGF23 (B), phosphate (C), calcium (D), 1,25(OH)2D (E), and PTH (F). Data are presented as the mean ± standard deviation. Results from the two-way ANOVA are presented in the figure legends. Significant post-hoc differences are reported above the data, with horizontal bars highlighting significant treatment differences between animals of the same genotype and letters highlighting significant differences between Hyp mice and vehicle treated WTs (a) and Scl-Ab treated WTs (b).
Figure 3.
μCT data of cortical area (Ct.Ar) (A & B) and bone volume/total volume (BV/TV) (C & D) in 12 and 20-week-old mice. Data from male mice are presented on the left and female mice data are on the right. Data are presented as the mean ± standard deviation. Results from the two-way ANOVA are presented in the figure legends. Significant post-hoc differences are reported above the data, with horizontal bars highlighting significant treatment differences between animals of the same genotype and letters highlighting significant differences between Hyp mice and vehicle treated WTs (a) and Scl-Ab treated WTs (b).
Figure 4.
Mechanical data of bending moment (A) and rigidity (B) in the 12-week-old mice. Data from male mice are presented on the left and female mice data are on the right. Data are presented as the mean ± standard deviation. Results from the two-way ANOVA are presented in the figure legends. Significant post-hoc differences are reported above the data, with horizontal bars highlighting significant treatment differences between animals of the same genotype and letters highlighting significant differences between Hyp mice and vehicle treated WTs (a) and Scl-Ab treated WTs (b).
Figure 5.
Mechanical data of bending moment (A) and rigidity (B) in the 20-week-old mice. Data from male mice are presented on the left and female mice data are on the right. Data are presented as the mean ± standard deviation. Results from the two-way ANOVA are presented in the figure legends. Significant post-hoc differences are reported above the data, with horizontal bars highlighting significant treatment differences between animals of the same genotype and letters highlighting significant differences between Hyp mice and vehicle treated WTs (a) and Scl-Ab treated WTs (b).
Figure 6.
Gene expression data of kidney sodium-phosphate transporters NPT2a (A) and NPT2c (B) in the 12-week-old mice. Data from male mice are presented on the left and female mice data are on the right. Data are presented as the mean ± standard deviation. Results from the two-way ANOVA are presented in the figure legends.
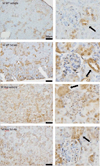
Figure 7.
Representative NPT2a immunohistochemistry kidney sections from 20-week-old male mice. Left panels are representative images at 10x, while right panels are insets at 20x highlighting the glomeruli and proximal tubules. The black arrows point to the proximal tubules the primary location of NPT2a expression. Scale bar = 100μm.
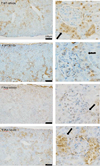
Figure 8.
Representative NPT2a immunohistochemistry kidney sections from 20-week-old female mice. Left panels are representative images at 10x, while right panels are insets at 20x highlighting glomeruli and proximal tubules. The black arrows point to the proximal tubules, the primary location of NPT2a expression. Scale bar = 100μm.
Similar articles
- Sclerostin antibody improves alveolar bone quality in the Hyp mouse model of X-linked hypophosphatemia (XLH).
Carpenter KA, Alkhatib DO, Dulion BA, Guirado E, Patel S, Chen Y, George A, Ross RD. Carpenter KA, et al. Int J Oral Sci. 2023 Oct 10;15(1):47. doi: 10.1038/s41368-023-00252-1. Int J Oral Sci. 2023. PMID: 37813865 Free PMC article. - Sclerostin Antibody Treatment Increases Bone Mass and Normalizes Circulating Phosphate Levels in Growing Hyp Mice.
Carpenter KA, Ross RD. Carpenter KA, et al. J Bone Miner Res. 2020 Mar;35(3):596-607. doi: 10.1002/jbmr.3923. Epub 2019 Dec 10. J Bone Miner Res. 2020. PMID: 31743490 Free PMC article. - Distinct roles for intrinsic osteocyte abnormalities and systemic factors in regulation of FGF23 and bone mineralization in Hyp mice.
Liu S, Tang W, Zhou J, Vierthaler L, Quarles LD. Liu S, et al. Am J Physiol Endocrinol Metab. 2007 Dec;293(6):E1636-44. doi: 10.1152/ajpendo.00396.2007. Epub 2007 Sep 11. Am J Physiol Endocrinol Metab. 2007. PMID: 17848631 - Mineralized tissues in hypophosphatemic rickets.
Robinson ME, AlQuorain H, Murshed M, Rauch F. Robinson ME, et al. Pediatr Nephrol. 2020 Oct;35(10):1843-1854. doi: 10.1007/s00467-019-04290-y. Epub 2019 Aug 8. Pediatr Nephrol. 2020. PMID: 31392510 Review. - Regulation of bone-renal mineral and energy metabolism: the PHEX, FGF23, DMP1, MEPE ASARM pathway.
Rowe PS. Rowe PS. Crit Rev Eukaryot Gene Expr. 2012;22(1):61-86. doi: 10.1615/critreveukargeneexpr.v22.i1.50. Crit Rev Eukaryot Gene Expr. 2012. PMID: 22339660 Free PMC article. Review.
Cited by
- Sclerostin antibody enhances implant osseointegration in bone with Col1a1 mutation.
Sung HH, Kwon HH, Stephan C, Reynolds SM, Dai Z, Van der Kraan PM, Caird MS, Blaney Davidson EN, Kozloff KM. Sung HH, et al. Bone. 2024 Sep;186:117167. doi: 10.1016/j.bone.2024.117167. Epub 2024 Jun 13. Bone. 2024. PMID: 38876270 Free PMC article. - Both enantiomers of β-aminoisobutyric acid BAIBA regulate Fgf23 via MRGPRD receptor by activating distinct signaling pathways in osteocytes.
Sakamoto E, Kitase Y, Fitt AJ, Zhu Z, Awad K, Brotto M, White KE, Welc SS, Bergwitz C, Bonewald LF. Sakamoto E, et al. Cell Rep. 2024 Jul 23;43(7):114397. doi: 10.1016/j.celrep.2024.114397. Epub 2024 Jun 25. Cell Rep. 2024. PMID: 38935499 Free PMC article. - Wnt pathway inhibitors are upregulated in XLH dental pulp cells in response to odontogenic differentiation.
Guirado E, Villani C, Petho A, Chen Y, Maienschein-Cline M, Lei Z, Los N, George A. Guirado E, et al. Int J Oral Sci. 2023 Feb 27;15(1):13. doi: 10.1038/s41368-022-00214-z. Int J Oral Sci. 2023. PMID: 36849506 Free PMC article. - Sclerostin inhibition in rare bone diseases: Molecular understanding and therapeutic perspectives.
Xiaohui T, Wang L, Yang X, Jiang H, Zhang N, Zhang H, Li D, Li X, Zhang Y, Wang S, Zhong C, Yu S, Ren M, Sun M, Li N, Chen T, Ma Y, Li F, Liu J, Yu Y, Yue H, Zhang Z, Zhang G. Xiaohui T, et al. J Orthop Translat. 2024 Jun 19;47:39-49. doi: 10.1016/j.jot.2024.05.004. eCollection 2024 Jul. J Orthop Translat. 2024. PMID: 39007037 Free PMC article. Review. - Sclerostin antibody improves alveolar bone quality in the Hyp mouse model of X-linked hypophosphatemia (XLH).
Carpenter KA, Alkhatib DO, Dulion BA, Guirado E, Patel S, Chen Y, George A, Ross RD. Carpenter KA, et al. Int J Oral Sci. 2023 Oct 10;15(1):47. doi: 10.1038/s41368-023-00252-1. Int J Oral Sci. 2023. PMID: 37813865 Free PMC article.
References
- Alon, U.S., Hypophosphatemic vitamin D-resistant rickets. Primer on the Metabolic Bone Diseases and Disorders of Mineral Metabolism, ed. Favus MJ. Vol. 6th Ed. 2006, Washington, DC, USA: The American Society for Bone and Mineral Research. 342–345.
- A gene (PEX) with homologies to endopeptidases is mutated in patients with X-linked hypophosphatemic rickets. The HYP Consortium. Nat Genet, 1995. 11(2): p. 130–6. - PubMed
- Pavone V, et al., Hypophosphatemic rickets: etiology, clinical features and treatment. Eur J Orthop Surg Traumatol, 2015. 25(2): p. 221–6. - PubMed
- Shimada T, et al., FGF-23 Is a Potent Regulator of Vitamin D Metabolism and Phosphate Homeostasis. Journal of Bone and Mineral Research, 2004. 19(3): p. 429–435. - PubMed
Publication types
MeSH terms
Substances
LinkOut - more resources
Full Text Sources
Molecular Biology Databases
Research Materials
Miscellaneous


