Melatonin Reduces Neuroinflammation and Improves Axonal Hypomyelination by Modulating M1/M2 Microglia Polarization via JAK2-STAT3-Telomerase Pathway in Postnatal Rats Exposed to Lipopolysaccharide - PubMed (original) (raw)
Melatonin Reduces Neuroinflammation and Improves Axonal Hypomyelination by Modulating M1/M2 Microglia Polarization via JAK2-STAT3-Telomerase Pathway in Postnatal Rats Exposed to Lipopolysaccharide
Qiuping Zhou et al. Mol Neurobiol. 2021 Dec.
Abstract
Microglia activation and associated inflammation are implicated in the periventricular white matter damage (PWMD) in septic postnatal rats. This study investigated whether melatonin would mitigate inflammation and alleviate the axonal hypomyelination in the corpus callosum in septic postnatal rats. We further explored if this might be related to the modulation of microglial polarization from M1 phenotype to M2 through the JAK2/STAT3/telomerase pathway. We reported here that indeed melatonin not only can it reduce the neurobehavioral disturbances in LPS-injected rats, but it can also dampen microglia-mediated inflammation. Thus, in LPS + melatonin group, the expression of proinflammatory mediators in M1 phenotype microglia was downregulated. As opposed to this, M2 microglia were increased which was accompanied by upregulated expression of anti-inflammatory mediators along with telomerase reverse transcriptase or melatonin receptor 1(MT1). In parallel to this was decreased NG2 expression but increased expression of myelin and neurofilament proteins. Melatonin can improve hypomyelination which was confirmed by electron microscopy. In vitro in primary microglia stimulated by LPS, melatonin decreased the expression of proinflammatory mediators significantly; but it increased the expression of anti-inflammatory mediators. Additionally, the expression levels of p-JAK2 and p-STAT3 were significantly elevated in microglia after melatonin treatment. Remarkably, the effect of melatonin on LPS-treated microglia was blocked by melatonin receptor, JAK2, STAT3 and telomerase reverse transcriptase inhibitors, respectively. Taken together, it is concluded that melatonin can attenuate PWMD through shifting M1 microglia towards M2 via MT1/JAK2/STAT3/telomerase pathway. The results suggest a new therapeutic strategy whereby melatonin may be adopted to convert microglial polarization from M1 to M2 phenotype that would ultimately contribute to the attenuation of PWMD.
Keywords: Axonal hypomyelination; JAK2; Melatonin; Microglial polarization; Periventricular white matter damage; STAT3; Telomerase reverse transcriptase.
© 2021. The Author(s).
Conflict of interest statement
All authors read and consent to the final manuscript. All authors have approved publish the data in this manuscript. The authors declare that they have no conflict of interest.
Figures
Fig. 1
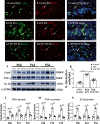
IL-1β, TNF-α and iNOS protein expression in the corpus callosum of postnatal rats at 6 h, 1 day and 3 days after LPS/melatonin injection and their matching controls. Double immunofluorescence staining shows the distribution of lectin labeled (A, D, G green), IL-1β (B, E, H red) and DAPI (blue) immunoreactive microglial cells in the corpus callosum at 1 day after the LPS/melatonin injection and their matching controls. The co-localized expression of lectin and IL-1β in microglia could be seen in C, F and I. IL-1β expression in microglia was increased at 1 day after LPS injection (D–F) when compared with control (A–C). However, IL-1β expression in microglia at 1 day was decreased after LPS + melatonin injection (G–I). Bar graph in K summarizes the frequency of IL-1β+/lectin+ cells at 1 day (n = 5 for each group). Quantification by immunoblot (J) showed increased IL-1β, TNF-α and iNOS protein expression at 6 h, 1 day and 3 days after LPS injection when compared with controls, but it was noticeably decreased in LPS + melatonin group. Graphs L, M and N show optical density changes of IL-1β, TNF-α and iNOS, respectively, relative to GAPDH (n = 5 for each group). In graph K–N, the circle, triangle and square represent the control groups, LPS groups and LPS + MT groups, respectively. Scale bars: A–I 20 µm. *P < 0.05, **P < 0.01
Fig. 2
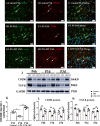
CD206 and TGF-β protein expression in the corpus callosum of postnatal rats at 6 h, 1 day and 3 days after LPS/melatonin injection and their matching controls. Double immunofluorescence staining shows the distribution of lectin labeled (A, D, G green), CD206 (B, E, H red), and DAPI (blue) immunoreactive microglial cells in the corpus callosum at 1 day after the LPS/melatonin injection and their matching controls. Co-localized expression of lectin and CD206 in microglia could be seen in C, F and I. Note CD206 expression in microglia was decreased at 1 day after LPS injection (D–F) when compared with control (A–C). However, CD206 expression in microglia at 1 day was increased after LPS + melatonin injection (G–I). Bar graph in K summarizes the frequency of CD206+/lectin+ cells at 1 day (n = 5 for each group). Quantification by immunoblot (J) showed decreased CD206 and TGF-β protein expression at 6 h, 1 day and 3 days after LPS injection when compared with controls, but it was noticeably increased in LPS + melatonin group. Graphs L and M show optical density changes of CD206 and TGF-β, respectively, relative to β-actin (n = 5 for each group). In graph K–M, the circle, triangle and square represent the control groups, LPS groups and LPS + MT groups, respectively. Scale bars: A–I 20 µm. *P < 0.05, **P < 0.01
Fig. 3
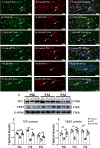
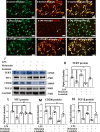
Protein expression of TERT and MT1 in the corpus callosum at 6 h, 1 day and 3 days of postnatal rats after LPS/melatonin administration and their matching controls. Panels A–R show lectin labeled and TERT or MT1 immunoreactive microglial cells in the corpus callosum at 1 day after LPS injection (B, E, H, K, N, Q), LPS + melatonin administration (C, F, I, L, O, R) and their corresponding controls (A, D, G, J, M, P), (n = 5 for each group). Graph S–U are western blot analysis of TERT and MT1 protein expression in the corpus callosum at 6 h, 1 day and 3 days of postnatal rats after LPS/melatonin administration and their corresponding controls. Graph T and U showed optical density changes of TERT and MT1 relative to GAPDH (n = 5 for each group). In graph T–U, the circle, triangle and square represent the control groups, LPS groups and LPS + MT groups, respectively. Note TERT and MT1 expression in microglia was attenuated at 1 day after LPS injection; but the expression of both proteins was increased after LPS + melatonin administration. Scale bars: A–L 20 µm. *P < 0.05, **P < 0.01
Fig. 4
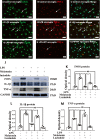
Melatonin reversed the enhanced expression of proinflammatory mediators in primary microglia stimulated by LPS in vitro. Immunofluorescence images of cultured primary microglia show expression of lectin (green), TNF-α(red) and DAPI (blue) (A–I) at 24 h after the LPS or melatonin treatment when compared with the corresponding control. Panel J shows iNOS (130 kDa), TNF-α (26 kDa), IL-1β (17 kDa) and GAPDH (37 kDa) immunoreactive bands. Bar graphs in K–M show optical density changes of iNOS, TNF-α and IL-1β relative to GAPDH of each group. Note LPS increased the expression of iNOS, TNF-α and IL-1β protein expression in primary microglia. Melatonin treatment could significantly reverse the high expression of IL-1β, iNOS and TNF-α proteins induced by LPS. Remarkably, the effect of melatonin was blocked by luzindole. Scale bars: A–I 20 µm. *P < 0.05, n = 5 for each group
Fig. 5
Melatonin reversed the low expression of anti-inflammatory mediators, TERT and melatonin receptor MT1 in primary microglia stimulated by LPS in vitro. Immunofluorescence images of cultured primary microglia show expression of lectin (green), CD206 (red) and DAPI (blue) (A–I) at 24 h after the LPS or melatonin treatment when compared with the corresponding control. Panel J shows CD206 (166 kDa), TGF-β (50 kDa), TERT (127 kDa), MT1 (47 kDa) and GAPDH (37 kDa) immunoreactive bands. Bar graphs in K-N show optical density changes of CD206, TGF-β, TERT, MT1 relative to GAPDH. Note LPS decreased the expression of CD206, TGF-β, TERT and MT1 protein expression in primary microglia. Melatonin treatment could significantly reverse the low expression of CD206, TGF-β, TERT and MT1 proteins induced by LPS. Of note, the effect of melatonin was blocked by luzindole. Scale bars: A–I 20 µm. *P < 0.05, n = 5 for each group
Fig. 6
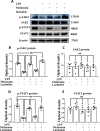
Melatonin activates JAK2/STAT3 pathway in microglia exposed to LPS in vitro. Panel A shows p-JAK2(131 kDa), JAK2(131 kDa), p-STAT3(88 kDa), STAT3(88 kDa) and β-actin(42 kDa) immunoreactive bands. Bar graphs in B-E show optical density changes of p-JAK2, JAK2, p-STAT3, STAT3 relative to β-actin of each group. Note melatonin treatment activates JAK2/STAT3 pathway and then modulate the conversion of M1 to M2 polarization. Note the effect of melatonin was blocked by luzindole. Scale bars: A–I 20 µm. *P < 0.05, n = 5 for each group
Fig. 7
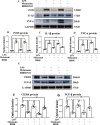
Melatonin modulates microglia polarization from M1 to M2 phenotype through increased telomerase expression in vitro. Panel A shows proinflammatory mediators, including iNOS (130 kDa), TNF-α (26 kDa), IL-1β (17 kDa) and GAPDH (37 kDa) immunoreactive bands and panel E shows anti-inflammatory mediators, including CD206 (166 kDa), TGF-β (50 kDa) and GAPDH (37 kDa) immunoreactive bands after the LPS, melatonin or BIBR (a non-competitive inhibitor of telomerase activity) treatment when compared with the corresponding control in primary microglia. Bar graphs in B–D and F–G show optical density changes of iNOS, TNF-α, IL-1β, CD206 and TGF-β relative to GAPDH of each group. Note melatonin treatment could significantly reverse the high expression of pro-inflammation proteins and also the low expression of anti-inflammation proteins induced by LPS. The protective effect of melatonin, however, was abrogated when telomerase expression was inhibited by BIBR1532. Scale bars: *P < 0.05, n = 5 for each group
Fig. 8
Table of Contents Image (TOCI): a schematic diagram depicting the cellular and molecular events associated with melatonin treatment in postnatal rats given LPS injection. The illustration follows two paths: the solid line shows that melatonin binds to its cognate receptor (MT1) on the microglia which activates the JAK2/STAT3 pathways and increases the expression of telomerase in the nucleus. This decreases M1 microglial production of proinflammatory cytokines, such as IL-1β, TNF-α and iNOS, and increases M2 production of anti-inflammatory cytokines, such as CD206 and TGF-β. Dash line denotes the effect of LPS on microglia. LPS stimulates toll-like receptor 4 (TLR4) which recruits its downstream NF-κB pathway, and ultimately mediates the production of proinflammatory mediators [59]. However, LPS inhibits the activation of JKA2/STAT3 pathway and reduces the expression p-JAK2 and p-STAT3 proteins expression, which is contrary to melatonin treatment. Production of proinflammatory cytokines by M1 microglia causes hypomyelination in the corpus callosum after LPS administration; while production of anti-inflammatory cytokines by M2 induced by melatonin improves hypomyelination
Similar articles
- Fingolimod Protects Against Ischemic White Matter Damage by Modulating Microglia Toward M2 Polarization via STAT3 Pathway.
Qin C, Fan WH, Liu Q, Shang K, Murugan M, Wu LJ, Wang W, Tian DS. Qin C, et al. Stroke. 2017 Dec;48(12):3336-3346. doi: 10.1161/STROKEAHA.117.018505. Epub 2017 Nov 7. Stroke. 2017. PMID: 29114096 Free PMC article. - Erythropoietin ameliorates early brain injury after subarachnoid haemorrhage by modulating microglia polarization via the EPOR/JAK2-STAT3 pathway.
Wei S, Luo C, Yu S, Gao J, Liu C, Wei Z, Zhang Z, Wei L, Yi B. Wei S, et al. Exp Cell Res. 2017 Dec 15;361(2):342-352. doi: 10.1016/j.yexcr.2017.11.002. Epub 2017 Nov 2. Exp Cell Res. 2017. PMID: 29102603 - Melatonin regulates microglial M1/M2 polarization via AMPKα2-mediated mitophagy in attenuating sepsis-associated encephalopathy.
Yang Y, Ke J, Cao Y, Gao Y, Lin C. Yang Y, et al. Biomed Pharmacother. 2024 Aug;177:117092. doi: 10.1016/j.biopha.2024.117092. Epub 2024 Jul 7. Biomed Pharmacother. 2024. PMID: 38976956 - Sodium tanshinone IIA sulfonate suppresses microglia polarization and neuroinflammation possibly via regulating miR-125b-5p/STAT3 axis to ameliorate neuropathic pain.
Zeng J, Gao WW, Yang H, Wang YN, Mei Y, Liu TT, Wang M, Tang L, Ma DC, Li W. Zeng J, et al. Eur J Pharmacol. 2024 Jun 5;972:176523. doi: 10.1016/j.ejphar.2024.176523. Epub 2024 Mar 28. Eur J Pharmacol. 2024. PMID: 38552937 - Targeting STAT3 signaling pathway in the treatment of Alzheimer's disease with compounds from natural products.
Wen X, Hu J. Wen X, et al. Int Immunopharmacol. 2024 Nov 15;141:112936. doi: 10.1016/j.intimp.2024.112936. Epub 2024 Aug 19. Int Immunopharmacol. 2024. PMID: 39163684 Review.
Cited by
- The Microbiota-Dependent Worsening Effects of Melatonin on Gut Inflammation.
da Silva JL, Barbosa LV, Pinzan CF, Nardini V, Brigo IS, Sebastião CA, Elias-Oliveira J, Brazão V, Júnior JCDP, Carlos D, Cardoso CRB. da Silva JL, et al. Microorganisms. 2023 Feb 11;11(2):460. doi: 10.3390/microorganisms11020460. Microorganisms. 2023. PMID: 36838425 Free PMC article. - Melatonin as a Therapy for Preterm Brain Injury: What Is the Evidence?
Häusler S, Robertson NJ, Golhen K, van den Anker J, Tucker K, Felder TK. Häusler S, et al. Antioxidants (Basel). 2023 Aug 17;12(8):1630. doi: 10.3390/antiox12081630. Antioxidants (Basel). 2023. PMID: 37627625 Free PMC article. Review. - Curcumin/pEGCG-encapsulated nanoparticles enhance spinal cord injury recovery by regulating CD74 to alleviate oxidative stress and inflammation.
Chen T, Wan L, Xiao Y, Wang K, Wu P, Li C, Huang C, Liu X, Xue W, Sun G, Ji X, Lin H, Ji Z. Chen T, et al. J Nanobiotechnology. 2024 Oct 24;22(1):653. doi: 10.1186/s12951-024-02916-4. J Nanobiotechnology. 2024. PMID: 39443923 Free PMC article. - Melatonin as a Potential Neuroprotectant: Mechanisms in Subarachnoid Hemorrhage-Induced Early Brain Injury.
Xu C, He Z, Li J. Xu C, et al. Front Aging Neurosci. 2022 Apr 29;14:899678. doi: 10.3389/fnagi.2022.899678. eCollection 2022. Front Aging Neurosci. 2022. PMID: 35572137 Free PMC article. Review. - IL-1β, the first piece to the puzzle of sepsis-related cognitive impairment?
Zhu Q, Wan L, Huang H, Liao Z. Zhu Q, et al. Front Neurosci. 2024 Apr 11;18:1370406. doi: 10.3389/fnins.2024.1370406. eCollection 2024. Front Neurosci. 2024. PMID: 38665289 Free PMC article. Review.
References
MeSH terms
Substances
Grants and funding
- 82072230/National Natural Science Foundation of China
- 2019A1515010206/Natural Science Foundation of Guangdong Province
- 202002030094/Guangzhou Municipal Science and Technology Project
- DFJH201804/High-level Hospital Construction Project
LinkOut - more resources
Full Text Sources
Research Materials
Miscellaneous
