Aeciospore ejection in the rust pathogen Puccinia graminis is driven by moisture ingress - PubMed (original) (raw)
Aeciospore ejection in the rust pathogen Puccinia graminis is driven by moisture ingress
Vanessa Bueno-Sancho et al. Commun Biol. 2021.
Abstract
Fungi have evolved an array of spore discharge and dispersal processes. Here, we developed a theoretical model that explains the ejection mechanics of aeciospore liberation in the stem rust pathogen Puccinia graminis. Aeciospores are released from cluster cups formed on its Berberis host, spreading early-season inoculum into neighboring small-grain crops. Our model illustrates that during dew or rainfall, changes in aeciospore turgidity exerts substantial force on neighboring aeciospores in cluster cups whilst gaps between spores become perfused with water. This perfusion coats aeciospores with a lubrication film that facilitates expulsion, with single aeciospores reaching speeds of 0.053 to 0.754 m·s-1. We also used aeciospore source strength estimates to simulate the aeciospore dispersal gradient and incorporated this into a publicly available web interface. This aids farmers and legislators to assess current local risk of dispersal and facilitates development of sophisticated epidemiological models to potentially curtail stem rust epidemics originating on Berberis.
© 2021. The Author(s).
Conflict of interest statement
D.G.O.S. is an Editorial Board Member for Communications biology, but was not involved in the editorial review of, nor the decision to publish this article. The authors declare no other competing interests.
Figures
Fig. 1. Polyhedral Pg aeciospores are tightly packed in aecial cups and expand, rounding-off when immersed in water.
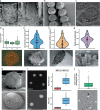
a, b Scanning electron micrographs of angular Pg aeciospores, tightly packed inside aecial cups, were frequently identified in chains once expelled onto the leaf surface. Aeciospores were also coated in verrucae that formed characteristic plugs on the aeciospore surface. Scale bars: 100 µm (aecial cups) and 20 µm (aeciospore chain). c Transmission electron micrograph of Pg aeciospores. White arrowheads indicate verrucae plugs. Scale bar: 5 µm. d Analysis of 129 Pg aecia from three independent locations (L1–3) showed that each aecium consisted of 8.3 cups (SD = 4.8) per mm2 of fungal area (n = 129). Red line, aecium border; white dots, individual cluster cups; scale bar: 1 mm. e Evaluation of scanning electron micrographs illustrated that each cluster cup contained 265 aeciospores (red dots) per layer (n = 47), f with an average width per layer of 13.9 µm (SD = 2.7; n = 52) and g average aecial cup length of 374.9 µm (SD = 145.9; n = 51). Scale bars: 100, 100, and 500 µm respectively. h Scanning electron micrographs of Pg aeciospores illustrating their two forms, polyhedral and near spherical. Scale bars: 5 µm. i Aeciospores immersed in water were significantly enlarged when compared to those immersed in glycerol. Pg aeciospores in glycerol had an average diameter of 13.6 µm (SD = 0.6) and area of 142.3 µm2 (SD = 11.1), whereas aeciospores immersed in water had an average diameter of 18.6 µm (SD = 2.0) and area of 262.4 µm2 (SD = 59.4). (**p < 0.01; _t_-test). n = 60; Scale bars: 20 µm. j Transmission electron micrographs show the space between aeciospores was an average of 2.0 µm (SD = 1.2; n = 138). White arrowheads, interspore gaps; Scale bar: 20 µm. For all box plots, bars represent median values, boxes signify the upper (Q3) and lower (Q1) quartiles, whiskers are located at 1.5 the inter-quartile range.
Fig. 2. Pg aeciospore release speed can be accurately predicted using lubrication theory.
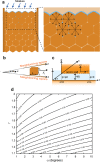
a Following moisture ingress and hydration of Pg aeciospores, the interspore gaps become perfused with water, coating aeciospores with a thin lubrication film. The increase in aeciospore volume through changes in turgidity increases the pressure on neighboring aeciospores, leading to violent ejection. b As the mature Pg aecium peridium ruptures at the apex it creates an angle of inclination (α) that propells aeciospores forward in the direction of the axis of symmetry, i.e., the positive x direction. Aeciospores were modeled as cuboids, with sides of length L×λ×λ. c The edge of the Pg aeciospore of length L is located at y=Ht, where Ht is the time-dependent gap. The force arising from the film pressure is given by P=Pn, where n is the unit vector that is normal to the spore face and pointing away from the liquid film and p0 reflects the heightened pressure acting at the base of each chain of aeciospores as a result of swelling within the aecial cup. The velocity components are given by Vy=dH/dt and Vz=dX/dtcosα. d Contour plots illustrate that predicted ejection speeds ranged from 0.02 to 0.5 m s−1 for a single aeciospore. Ejection speed was determined by varying the ejection angle α based on approximate values obtained through image analysis (1–11°, i.e., 0.02–0.2 radians).
Fig. 3. Pg aeciospores released in clusters achieve greater distances.
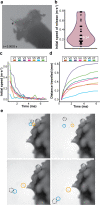
a Pg aeciospore ejection was recorded using high-speed videography at 3000 frames per second (fps). d, distance; t, time; s, seconds. b The initial ejection speed of Pg aeciospores ranged from 0.053 to 0.754 m s−1 (median 0.24 m s−1; n = 31). c, d After ejection, aeciospore speed rapidly decreased over time. Aeciospore speed of discharge was measured frame by frame until aeciospores began to decelerate as drag force was exerted. V1–7 represent seven independent aeciospore release events. e Aeciospores released in groups achieved greater distances. Single frames from high-speed videography of Pg aeciospore discharge. Black broken circle highlights a cluster of aeciospores being released, blue and orange circles highlight spores released in chains.
Fig. 4. Changes in temperature did not alter the rate of aeciospore release.
a The distance traveled by aeciospores following ejection was determined. B. vulgaris leaf fragments containing a single Pg aecium were attached to the wall of a 100 mm square petri dish and aeciospore discharge distances measured by analysis of spore quantity across a series of adjacent microscope slides with a thin (2%) water agar layer. Aecial cups were incubated at 18 °C and assessments made after 18 h. b Representative micrographs of aeciospores identified at different distances from the aecium (1.9, 2.6, 3, and 3.8 cm) illustrate that aeciospores found more than 2 cm from the aecium were commonly found in clusters. c–e Alterations in temperature did not influence the distance aeciospores traveled. Aeciospore release was evaluated under 5, 10, 18, 25, 30, 33, and 37 °C, with no significant difference found (n = 6, Tukey’s HSD; p < 0.01). f The number of aeciospores released was much lower than the predicted full potential. Aeciospore content (“predicted”) per aecium were estimated by measuring the fungal mass and compared to those recorded as released (“released”). n = 3; For all box plots, bars represent median values, boxes signify the upper (Q3) and lower (Q1) quartiles, whiskers are located at 1.5 the inter-quartile range.
Fig. 5. Aeciospore dispersal gradient can be simulated using a Gaussian Plume (GP) model.
a A GP model was used to simulate how far Pg aeciospores may travel following release. b B. vulgaris leaves were divided into four categories reflecting their predicted level of Pg infection. The percentage of fungal area was estimated for each group resulting in: 0.54% (low), 1.82% (medium), 5.26% (high) and 17.6% (very high). n = 85. c Density plots illustrate that the distance aeciospores traveled varied depending on source strength. Four source strength values were used to reflect the four levels of Pg infection: 316,121 (i), 1,065,445 (ii), 3,079,254 (iii) and 10,303,206.9 (iv) aeciospores. d Density plots show how environmental conditions considerably influence aeciospore dispersal. Upper graphs represent day conditions (620 W/m2 solar radiation and 10% cloud cover) lower graphs represent night conditions (no solar radiation and 50% cloud cover). Wind speed was set at 1 m s−1 (left graphs) and 4 m s−1 (right graphs).
Fig. 6. The Gaussian Plume (GP) aeciospore dispersal model was integrated into a webapp interface.
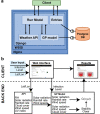
a Diagram illustrating the core components of the webapp developed using Django, with a postgres database and nginx web server. WSGI web server gateway interface, API application programming interface, DB database. b Illustration of the utility of the aeciospore dispersal model webapp. When a request is submitted, the location (latitude/longitude) is input into an API that gathers weather data and inputs this into the GP model with the infection level provided by the user. The results are returned illustrating the density of aeciospores at various distances from a _Pg_-infected B. vulgaris bush for the current environmental conditions in the given location. RH relative humidity.
Similar articles
- Stem rust of small grains and grasses caused by Puccinia graminis.
Leonard KJ, Szabo LJ. Leonard KJ, et al. Mol Plant Pathol. 2005 Mar 1;6(2):99-111. doi: 10.1111/j.1364-3703.2005.00273.x. Mol Plant Pathol. 2005. PMID: 20565642 - Autophagocytosis of carotenoid-rich lipid droplets into vacuoles during aeciospore ageing in Puccinia distincta.
Weber RWS, Davoli P. Weber RWS, et al. New Phytol. 2002 May;154(2):471-479. doi: 10.1046/j.1469-8137.2002.00377.x. New Phytol. 2002. PMID: 33873435 - Diversity of Puccinia striiformis on cereals and grasses.
Hovmøller MS, Sørensen CK, Walter S, Justesen AF. Hovmøller MS, et al. Annu Rev Phytopathol. 2011;49:197-217. doi: 10.1146/annurev-phyto-072910-095230. Annu Rev Phytopathol. 2011. PMID: 21599494 Review. - Role of Alternate Hosts in Epidemiology and Pathogen Variation of Cereal Rusts.
Zhao J, Wang M, Chen X, Kang Z. Zhao J, et al. Annu Rev Phytopathol. 2016 Aug 4;54:207-28. doi: 10.1146/annurev-phyto-080615-095851. Epub 2016 Jan 1. Annu Rev Phytopathol. 2016. PMID: 27296143 Review.
References
Publication types
MeSH terms
Supplementary concepts
Grants and funding
- BB/S003975/1/BB_/Biotechnology and Biological Sciences Research Council/United Kingdom
- BB/M011216/1/BB_/Biotechnology and Biological Sciences Research Council/United Kingdom
- BB/P012574/1/BB_/Biotechnology and Biological Sciences Research Council/United Kingdom
- BB/P016855/1/BB_/Biotechnology and Biological Sciences Research Council/United Kingdom
LinkOut - more resources
Full Text Sources


