A shark's eye view: testing the 'mistaken identity theory' behind shark bites on humans - PubMed (original) (raw)
A shark's eye view: testing the 'mistaken identity theory' behind shark bites on humans
Laura A Ryan et al. J R Soc Interface. 2021 Oct.
Abstract
Shark bites on humans are rare but are sufficiently frequent to generate substantial public concern, which typically leads to measures to reduce their frequency. Unfortunately, we understand little about why sharks bite humans. One theory for bites occurring at the surface, e.g. on surfers, is that of mistaken identity, whereby sharks mistake humans for their typical prey (pinnipeds in the case of white sharks). This study tests the mistaken identity theory by comparing video footage of pinnipeds, humans swimming and humans paddling surfboards, from the perspective of a white shark viewing these objects from below. Videos were processed to reflect how a shark's retina would detect the visual motion and shape cues. Motion cues of humans swimming, humans paddling surfboards and pinnipeds swimming did not differ significantly. The shape of paddled surfboards and human swimmers was also similar to that of pinnipeds with their flippers abducted. The difference in shape between pinnipeds with abducted versus adducted flippers was bigger than between pinnipeds with flippers abducted and surfboards or human swimmers. From the perspective of a white shark, therefore, neither visual motion nor shape cues allow an unequivocal visual distinction between pinnipeds and humans, supporting the mistaken identity theory behind some bites.
Keywords: object motion; prey detection; shape discrimination; shark attack; shark vision.
Figures
Figure 1.
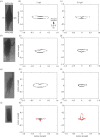
Direction and strength of motion cues from the 2DMD model of (a_–_c) a pinniped swimming, (d_–_f) a human paddling a surfboard, (g_–_i) a human swimming and (j_–_l) a rectangular float towed through the water. Modelling was performed assuming a spatial resolving power of either 5 cpd (b,e,h,k) or 2.5 cpd (c,f,i,l). Red open dots indicate angle vectors that were significantly different from the pinniped and black dots were not significantly different. Units are an arbitrary scaling value. Dashed lines on (a) show the division of the object for analysis of the different ‘faces’. Only the rectangular float differed from the pinniped at 2.5 cpd.
Figure 2.
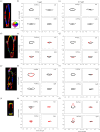
Mean direction and strength of motion cues for each object from the 2DMD model of (a_–_c) a pinniped swimming, (d_–_f) a human paddling a surfboard, (g_–_i) a human swimming and (j_–_l) a rectangular float towed through the water, calculated for the four different faces (leading edge, left side, trailing edge, right side) at 5 cpd (b,e,h,k) and 2.5 cpd (c,f,i,l). Red open dots represent motion directions that were significantly different from that of the pinniped and black dots were not significantly different. Units are an arbitrary scaling value. Panels (a,d,g,j) show example frames of motion direction over pixel location, where pixel colour corresponds to the motion direction in the colour wheel (inlay a).
Figure 3.
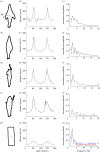
Five examples of the roundness shape analysis for the different object categories. (a_–_c) A pinniped with its flippers abducted; (d_–_f) a pinniped in a streamlined position; (g_–_i) a human swimming; (j_–_l) a human paddling a surfboard; and (m_–_o) a rectangular float. The mean distance from the centroid to the edge of the shape measured in 2° increments (b,e,h,k,n) and the normalized FFT amplitudes (c,f,i,l,o) are also shown. Red asterisks represent FFT frequencies that were significantly different from the pinniped in a streamlined pose, and blue asterisks represent FFT frequencies that were significantly different from the pinniped with its flippers abducted.
Figure 4.
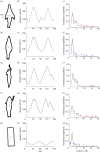
Five examples of the edge projection shape analysis for the different object categories. (a_–_c) A pinniped with its flippers abducted; (d_–_f) a pinniped in a streamlined position; (g_–_i) a human swimming; (j_–_l) a human paddling a surfboard; and (m_–_o) a rectangular float. The mean distance from the centroid to the edge, divided into 180 equal length curves (b,e,h,k,n), and the normalized FFT amplitudes (c,f,i,l,o) are also shown. Red asterisks represent FFT frequencies significantly different from the pinniped in a streamline position and blue asterisks represent FFT frequencies significantly different from the pinniped with its flippers abducted.
Similar articles
- Use of forensic analysis to better understand shark attack behaviour.
Ritter E, Levine M. Ritter E, et al. J Forensic Odontostomatol. 2004 Dec;22(2):40-6. J Forensic Odontostomatol. 2004. PMID: 16223019 - Increased shark bite survivability revealed by two centuries of Australian records.
Tucker JP, Santos IR, Kelaher BP, Green M, Clark GF, Butcher PA. Tucker JP, et al. Sci Rep. 2022 Aug 19;12(1):14121. doi: 10.1038/s41598-022-16950-5. Sci Rep. 2022. PMID: 35986014 Free PMC article. - Shark Spotters: Successfully reducing spatial overlap between white sharks (Carcharodon carcharias) and recreational water users in False Bay, South Africa.
Engelbrecht T, Kock A, Waries S, O'Riain MJ. Engelbrecht T, et al. PLoS One. 2017 Sep 25;12(9):e0185335. doi: 10.1371/journal.pone.0185335. eCollection 2017. PLoS One. 2017. PMID: 28945806 Free PMC article. - [Shark attacks in New Caledonia from 1958 to 2020: a review of cases].
Maillaud C, Tirard P, Borsa P, Guittonneau AL, Fournier J, Nour M. Maillaud C, et al. Med Trop Sante Int. 2022 Feb 10;2(1):mtsi.v2i1.2022.209. doi: 10.48327/mtsi.v2i1.2022.209. eCollection 2022 Mar 31. Med Trop Sante Int. 2022. PMID: 35685842 Free PMC article. Review. French. - On the complexity of shark bite wounds: From associated bacteria to trauma management and wound repair.
Isci ET, Ritter E. Isci ET, et al. J Trauma Acute Care Surg. 2018 Aug;85(2):398-405. doi: 10.1097/TA.0000000000001920. J Trauma Acute Care Surg. 2018. PMID: 29613948 Review.
Cited by
- The Australian Shark-Incident Database for quantifying temporal and spatial patterns of shark-human conflict.
Riley M, Meagher P, Huveneers C, Leto J, Peddemors VM, Slip D, West J, Bradshaw CJA. Riley M, et al. Sci Data. 2022 Jul 6;9(1):378. doi: 10.1038/s41597-022-01453-9. Sci Data. 2022. PMID: 35794151 Free PMC article. - Patterns of overlapping habitat use of juvenile white shark and human recreational water users along southern California beaches.
Rex PT, May JH 3rd, Pierce EK, Lowe CG. Rex PT, et al. PLoS One. 2023 Jun 2;18(6):e0286575. doi: 10.1371/journal.pone.0286575. eCollection 2023. PLoS One. 2023. PMID: 37267342 Free PMC article. - High resolution acoustic telemetry reveals swim speeds and inferred field metabolic rates in juvenile white sharks (Carcharodon carcharias).
Anderson JM, Spurgeon E, Stirling BS, May J 3rd, Rex PT, Hyla B, McCullough S, Thompson M, Lowe CG. Anderson JM, et al. PLoS One. 2022 Jun 9;17(6):e0268914. doi: 10.1371/journal.pone.0268914. eCollection 2022. PLoS One. 2022. PMID: 35679282 Free PMC article. - Smart sharks: a review of chondrichthyan cognition.
Brown C, Schluessel V. Brown C, et al. Anim Cogn. 2023 Jan;26(1):175-188. doi: 10.1007/s10071-022-01708-3. Epub 2022 Nov 17. Anim Cogn. 2023. PMID: 36394656 Free PMC article. Review.
References
- Hazin FHV, Burgess GH, Carvalho FC. 2008. A shark attack outbreak off Recife, Pernambuco, Brazil: 1992–2006. Bull. Mar. Sci. 82, 199-212.
- Simmons P, Mehmet MI. 2018. Shark management strategy policy considerations: community preferences, reasoning and speculations. Mar. Policy 96, 111-119. (10.1016/j.marpol.2018.08.010) - DOI
- Dudley S, Cliff G. 2010. Shark control: methods, efficacy, and ecological impact. In Sharks and their relatives II: biodiversity, adaptive physiology and conservation (eds Carrier JC, Musick JA, Heithaus MR), pp. 567-592. Boca Raton, FL: CRC Press.
- McPhee DP, Blount C, Smith MPL, Peddemors VM. 2021. A comparison of alternative systems to catch and kill for mitigating unprovoked shark bite on bathers or surfers at ocean beaches. Ocean Coast. Manag. 201, 105492. (10.1016/j.ocecoaman.2020.105492) - DOI
- Reid DD, Robbins WD, Peddemors VM. 2011. Decadal trends in shark catches and effort from the New South Wales, Australia, Shark Meshing Program 1950–2010. Mar. Freshw. Res. 62, 676-693. (10.1071/MF10162) - DOI
Publication types
MeSH terms
LinkOut - more resources
Full Text Sources
Medical


