Randomized Controlled-Feeding Study of Dietary Emulsifier Carboxymethylcellulose Reveals Detrimental Impacts on the Gut Microbiota and Metabolome - PubMed (original) (raw)
Randomized Controlled Trial
. 2022 Mar;162(3):743-756.
doi: 10.1053/j.gastro.2021.11.006. Epub 2021 Nov 11.
Charlene Compher 2, Brittaney Bonhomme 3, Qing Liu 4, Yuan Tian 4, William Walters 5, Lisa Nessel 6, Clara Delaroque [ 7](#full-view-affiliation-7 "INSERM U1016, team "Mucosal microbiota in chronic inflammatory diseases,'' CNRS UMR 8104, Université de Paris, Paris, France."), Fuhua Hao 4, Victoria Gershuni 8, Lillian Chau 9, Josephine Ni 9, Meenakshi Bewtra 10, Lindsey Albenberg 11, Alexis Bretin 12, Liam McKeever 3, Ruth E Ley 5, Andrew D Patterson 4, Gary D Wu 9, Andrew T Gewirtz 13, James D Lewis 14
Affiliations
- PMID: 34774538
- PMCID: PMC9639366
- DOI: 10.1053/j.gastro.2021.11.006
Randomized Controlled Trial
Randomized Controlled-Feeding Study of Dietary Emulsifier Carboxymethylcellulose Reveals Detrimental Impacts on the Gut Microbiota and Metabolome
Benoit Chassaing et al. Gastroenterology. 2022 Mar.
Abstract
Background & aims: Epidemiologic and murine studies suggest that dietary emulsifiers promote development of diseases associated with microbiota dysbiosis. Although the detrimental impact of these compounds on the intestinal microbiota and intestinal health have been demonstrated in animal and in vitro models, impact of these food additives in healthy humans remains poorly characterized.
Methods: To examine this notion in humans, we performed a double-blind controlled-feeding study of the ubiquitous synthetic emulsifier carboxymethylcellulose (CMC) in which healthy adults consumed only emulsifier-free diets (n = 9) or an identical diet enriched with 15 g per day of CMC (n = 7) for 11 days.
Results: Relative to control subjects, CMC consumption modestly increased postprandial abdominal discomfort and perturbed gut microbiota composition in a way that reduced its diversity. Moreover, CMC-fed subjects exhibited changes in the fecal metabolome, particularly reductions in short-chain fatty acids and free amino acids. Furthermore, we identified 2 subjects consuming CMC who exhibited increased microbiota encroachment into the normally sterile inner mucus layer, a central feature of gut inflammation, as well as stark alterations in microbiota composition.
Conclusions: These results support the notion that the broad use of CMC in processed foods may be contributing to increased prevalence of an array of chronic inflammatory diseases by altering the gut microbiome and metabolome (ClinicalTrials.gov, number NCT03440229).
Keywords: Emulsifier; Metabolism; Metabolome; Microbiota.
Copyright © 2022 The Authors. Published by Elsevier Inc. All rights reserved.
Conflict of interest statement
Conflict of interest
Dr Lewis consulted or served on an advisory board for Eli Lilly and Company, Samsung Bioepis, UCB, Bristol-Myers Squibb, Nestle Health Science, Merck, Celgene, Janssen Pharmaceuticals, Bridge Biotherapeutics, Entasis Therapeutics, AbbVie, Pfizer, Gilead, Arena Pharmaceuticals, Protagonist Therapeutics, Amgen, and Scipher Medicine. He has had research funding from Nestle Health Science, Takeda, Janssen Pharmaceuticals, and AbbVie. The remaining authors disclose no conflicts.
Figures
Figure 1.
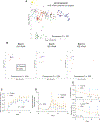
Effect of CMC consumption on metabolic parameters. (A) Schematic representation of the inpatient study that enabled daily monitoring and specimen collections before, during, and after CMC consumption, or lack thereof, and presenting timing of oral glucose tolerance tests, intestinal biopsies, and feces collection. (B) Biomorphometric characterization of the study’s participants at the beginning of the study. (C) Effect of dietary emulsifier CMC consumption on various metabolic parameters, measured both pre- and postintervention. (D_–_F) Effect of dietary emulsifier CMC consumption on weight (D), PROMISE gas/bloating (E), and belly pain (F) scores, measured both pre- and postintervention. OGTT, oral glucose tolerance test. Significance was determined using Mann-Whitney test; *P < 0.05 compared with control group.
Figure 2.
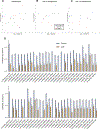
Effect of CMC consumption on microbiota composition. (A) PCoA of the unweighted UniFrac distance matrix of the study participants’ microbiota assessed by 16S rRNA gene sequencing. All time points are included in the representation, and samples are colored by participants. (B) PCoA of the Bray-Curtis distance matrix at days 0, 9, and 14 of study participants’ microbiota composition after normalization of every SV based on day 4 value, with samples colored by group. (C) Changes in the microbial community structure over time, as measured by Bray-Curtis distance from day 4 to subsequent days, for each group. (D) Fecal bacterial load assessed by 16S quantitative polymerase chain reaction (qPCR). (E) Changes in Evenness and Shannon alpha diversity measures for CMC intervention versus control groups, at days 0, 9, and 14. Significance was determined using 2-way ANOVA corrected for multiple comparisons with a Bonferroni posttest (E), multiple t tests (E) or Permanova analysis (A, B).
Figure 3.
Effect of CMC consumption on fecal metagenome. (A) PCoA of the Bray-Curtis dissimilarity of study’s participants metagenome (uniref90 categories) assessed by shotgun sequencing. Days 4 and 14 are included in the representation, and samples are colored by participants. (B, C) PCoA of the Bray-Curtis distance matrix at day 4 (B) and 14 (C) of study’s participants metagenome assessed by shotgun sequencing, with samples colored by group.
Figure 4.
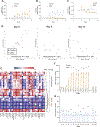
Effect of CMC consumption on the fecal metabolome. (A) Changes of the fecal level of bioactive lipopolysaccharide from day 0 to subsequent days measured with HEK-TLR4 reporter cells. (B) Changes of the fecal level of bioactive flagellin from day 0 to subsequent days measured with HEK-TLR5 reporter cells. (C) Changes of the fecal level of the inflammatory marker Lipocalin-2 from day 0 to subsequent days. (D) PCoA of the Euclidean distance at days 0, 9, and 14 of study participants’ fecal metabolome, with samples colored by group. (E) Heatmap presenting participants fecal metabolome over the course of the study. (F) Changes of the fecal level of CMC from day 0 to subsequent days in both control and CMC-treated groups. (G) Changes of the fecal level of CMC from day 0 to subsequent days in control group. Significance was determined using 2-way ANOVA corrected for multiple comparisons with a Bonferroni posttest or repeated t tests corrected with the false discovery rate approach for (G); *P < .05 compared with control group for (F), *P < .05 compared with day 0 for (G).
Figure 5.
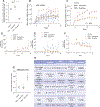
Intersubject variability in the response to CMC consumption. (A) Effect of dietary emulsifier CMC consumption on microbiota localization (distance of the closest bacteria from the surface of the epithelium), measured both pre- and postintervention. (B) Changes of the Bray-Curtis distance matrix, for each study’s participant from the CMC-treated group, from day 4 to subsequent days. (C) Changes of the Bray-Curtis distance matrix, for the CMC-Insensitive and the CMC-Sensitive groups, from day 4 to subsequent days. (D) Changes of the fecal level of bioactive LPS from day 0 to subsequent days measured with HEK-TLR4 reporter cells. (E) Changes of the fecal level of bioactive flagellin from day 0 to subsequent days measured with HEK-TLR5 reporter cells. (F) Changes of the fecal level of the inflammatory marker Lipocalin-2 from day 0 to subsequent days. (G) Effect of dietary emulsifier CMC consumption on fecal metagenome measured through Bray-Curtis distance. (H) Biomorphometric characterization of study’s participants at the beginning of the study and according to CMC sensitivity status. Significance was determined using 1-way ANOVA corrected for multiple comparisons with a Bonferroni posttest (A and G) or 2-way ANOVA corrected for multiple comparisons with a Bonferroni posttest (C, D, E, and F). BMI, body mass index; DBP, diastolic blood pressure; IEC, intestinal epithelial cell; LPS, lipopolysaccharide; NS, not statistically significant; SBP, systolic blood pressure.
Comment in
- The Role of Carboxymethylcellulose in Health and Disease: Is the Plot Thickening?
Wellens J, Vermeire S, Sabino J. Wellens J, et al. Gastroenterology. 2022 Sep;163(3):780-781. doi: 10.1053/j.gastro.2022.01.007. Epub 2022 Jan 11. Gastroenterology. 2022. PMID: 35026236 No abstract available.
Similar articles
- In vitro microbiota model recapitulates and predicts individualised sensitivity to dietary emulsifier.
Rytter H, Naimi S, Wu G, Lewis J, Duquesnoy M, Vigué L, Tenaillon O, Belda E, Vazquez-Gomez M, Touly N, Arnone D, Hao F, Ley RE, Clément K, Peyrin-Biroulet L, Patterson AD, Gewirtz AT, Chassaing B. Rytter H, et al. Gut. 2025 Apr 7;74(5):761-774. doi: 10.1136/gutjnl-2024-333925. Gut. 2025. PMID: 39870396 Free PMC article. - The Emulsifier Carboxymethylcellulose Induces More Aggressive Colitis in Humanized Mice with Inflammatory Bowel Disease Microbiota Than Polysorbate-80.
Rousta E, Oka A, Liu B, Herzog J, Bhatt AP, Wang J, Habibi Najafi MB, Sartor RB. Rousta E, et al. Nutrients. 2021 Oct 12;13(10):3565. doi: 10.3390/nu13103565. Nutrients. 2021. PMID: 34684567 Free PMC article. - Dietary emulsifiers impact the mouse gut microbiota promoting colitis and metabolic syndrome.
Chassaing B, Koren O, Goodrich JK, Poole AC, Srinivasan S, Ley RE, Gewirtz AT. Chassaing B, et al. Nature. 2015 Mar 5;519(7541):92-6. doi: 10.1038/nature14232. Epub 2015 Feb 25. Nature. 2015. PMID: 25731162 Free PMC article. - How diet can impact gut microbiota to promote or endanger health.
Chassaing B, Vijay-Kumar M, Gewirtz AT. Chassaing B, et al. Curr Opin Gastroenterol. 2017 Nov;33(6):417-421. doi: 10.1097/MOG.0000000000000401. Curr Opin Gastroenterol. 2017. PMID: 29019865 Free PMC article. Review. - Review article: emulsifiers in the food supply and implications for gastrointestinal disease.
Halmos EP, Mack A, Gibson PR. Halmos EP, et al. Aliment Pharmacol Ther. 2019 Jan;49(1):41-50. doi: 10.1111/apt.15045. Epub 2018 Nov 28. Aliment Pharmacol Ther. 2019. PMID: 30484878 Review.
Cited by
- Development of Novel High and Low Emulsifier Diets Based upon Emulsifier Distribution in the Australian Food Supply for Intervention Studies in Crohn's Disease.
Fitzpatrick JA, Gibson PR, Taylor KM, Halmos EP. Fitzpatrick JA, et al. Nutrients. 2024 Jun 18;16(12):1922. doi: 10.3390/nu16121922. Nutrients. 2024. PMID: 38931276 Free PMC article. Clinical Trial. - A Comprehensive Review of the Triangular Relationship among Diet-Gut Microbiota-Inflammation.
Randeni N, Bordiga M, Xu B. Randeni N, et al. Int J Mol Sci. 2024 Aug 29;25(17):9366. doi: 10.3390/ijms25179366. Int J Mol Sci. 2024. PMID: 39273314 Free PMC article. Review. - Dietary emulsifier consumption accelerates type 1 diabetes development in NOD mice.
Delaroque C, Chassaing B. Delaroque C, et al. NPJ Biofilms Microbiomes. 2024 Jan 6;10(1):1. doi: 10.1038/s41522-023-00475-4. NPJ Biofilms Microbiomes. 2024. PMID: 38182615 Free PMC article. - Impact of Dietary Patterns in Inflammatory Bowel Disease Subtypes Versus Healthy Subjects: a Retrospective Cohort Study.
Preda CM, Istratescu D, Nitescu M, Manuc T, Manuc M, Stroie T, Catrinoiu M, Tieranu C, Meianu CG, Tugui L, Ciora CA, Louis E, Diculescu M. Preda CM, et al. Maedica (Bucur). 2023 Jun;18(2):174-181. doi: 10.26574/maedica.2023.18.2.174. Maedica (Bucur). 2023. PMID: 37588829 Free PMC article. - Effects of Carboxymethylcellulose Artificial Tears on Ocular Surface Microbiome Diversity and Composition, A Randomized Controlled Trial.
Zhou Y, Sidhu GS, Whitlock JA, Abdelmalik B, Mayer Z, Li Y, Wang GP, Steigleman WA. Zhou Y, et al. Transl Vis Sci Technol. 2023 Aug 1;12(8):5. doi: 10.1167/tvst.12.8.5. Transl Vis Sci Technol. 2023. PMID: 37555738 Free PMC article. Clinical Trial.
References
- Martinez Steele E, Juul F, Neri D, et al. Dietary share of ultra-processed foods and metabolic syndrome in the US adult population. Prev Med 2019;125:40–48. - PubMed
- Caruso R, Lo BC, Nunez G. Host-microbiota interactions in inflammatory bowel disease. Nat Rev Immunol 2020;20:411–426. - PubMed
- Neurath MF. Host-microbiota interactions in inflammatory bowel disease. Nat Rev Gastroenterol Hepatol 2020;17:76–77. - PubMed
Publication types
MeSH terms
Substances
Grants and funding
- R01 DK099071/DK/NIDDK NIH HHS/United States
- UL1 TR001878/TR/NCATS NIH HHS/United States
- P30 DK050306/DK/NIDDK NIH HHS/United States
- R01 DK083890/DK/NIDDK NIH HHS/United States
- R21 DK115180/DK/NIDDK NIH HHS/United States
- P30 DK019525/DK/NIDDK NIH HHS/United States
LinkOut - more resources
Full Text Sources


