ASO-Based PKM Splice-Switching Therapy Inhibits Hepatocellular Carcinoma Growth - PubMed (original) (raw)
ASO-Based PKM Splice-Switching Therapy Inhibits Hepatocellular Carcinoma Growth
Wai Kit Ma et al. Cancer Res. 2022.
Abstract
The M2 pyruvate kinase (PKM2) isoform is upregulated in most cancers and plays a crucial role in regulation of the Warburg effect, which is characterized by the preference for aerobic glycolysis over oxidative phosphorylation for energy metabolism. PKM2 is an alternative-splice isoform of the PKM gene and is a potential therapeutic target. Antisense oligonucleotides (ASO) that switch PKM splicing from the cancer-associated PKM2 to the PKM1 isoform have been shown to induce apoptosis in cultured glioblastoma cells when delivered by lipofection. Here, we explore the potential of ASO-based PKM splice switching as a targeted therapy for liver cancer. A more potent lead constrained-ethyl (cEt)/DNA ASO induced PKM splice switching and inhibited the growth of cultured hepatocellular carcinoma (HCC) cells. This PKM isoform switch increased pyruvate-kinase activity and altered glucose metabolism. In an orthotopic HCC xenograft mouse model, the lead ASO and a second ASO targeting a nonoverlapping site inhibited tumor growth. Finally, in a genetic HCC mouse model, a surrogate mouse-specific ASO induced Pkm splice switching and inhibited tumorigenesis, without observable toxicity. These results lay the groundwork for a potential ASO-based splicing therapy for HCC.
Significance: Antisense oligonucleotides are used to induce a change in PKM isoform usage in hepatocellular carcinoma, reversing the Warburg effect and inhibiting tumorigenesis.
©2021 American Association for Cancer Research.
Conflict of interest statement
Conflict of Interest Statement
F.R. and C.F.B. are employees of Ionis Pharmaceuticals and own stock options. F.R., C.F.B., and A.R.K. are inventors on a patent application covering the use of PKM ASOs.
Figures
Figure 1.. Delivery of ASO1-cEt/DNA via lipofectamine induces PKM splice switching in Huh7 cells
(A) Radioactive RT-PCR shows the extent of PKM splice-switching after transfecting Huh7 cells with 60 nM ASO for two days. No-treatment control (NTC) with or without reverse transcriptase (+ RT or − RT, respectively) and a control ASO (Ctrl-cEt/DNA) with 5mismatch nucleotides to PKM exon 10 were used as controls. (B) Quantification of PKM1 and PKMds isoforms in panel (A). (C) RT-qPCR quantitation of the indicated transcripts upon ASO treatment as in panel (A). All tested transcripts were normalized to the HPRT transcript level. Relative expression to the NTC is presented. (D) Western blotting analysis of the PKM isoform switch after ASO treatment as in panel (A), with quantification of band intensities shown below; bands were normalized to tubulin and to the NTC The bar charts in panel (B and C) represent the average of three independent biological replicates ± SEM. One-way ANOVA was performed with Dunnett’s multiple comparison post-hoc test. ** P ≤ 0.01; *** P ≤ 0.001.
Figure 2.. Delivery of ASO1-cEt/DNA by free uptake induces PKM splice switching in Huh7 cells
(A) ASO1-cEt/DNA induces PKM splice switching in a dose-dependent manner. Radioactive RT-PCR analysis after treating Huh7 cells with varying ASO concentrations by free uptake for four days. (B) Quantification of PKM1 and PKMds isoforms in panel (A). (C) Radioactive RT-PCR analysis after treating Huh7 cells with 20 μM ASO by free uptake for 7 days. Medium and ASO were replenished on day 4. (D) Quantification of PKM1 and PKMds isoforms in panel (C). (E) RT-qPCR quantitation of the indicated transcripts upon ASO treatment as in panel (C). All tested transcripts were normalized to the HPRT transcript level. Relative expression versus the NTC is shown. (F) Western blotting analysis of the PKM isoform switch after treating Huh7 cells with ASO as in panel (C), with quantification of band intensities shown below; bands were normalized to tubulin and to the NTC. The bar charts in panels (B and D) represent the average of three independent biological replicates ± SEM. One-way ANOVA was performed with Dunnett’s multiple comparison post-hoc test. * P ≤ 0.05; ** P ≤ 0.01; *** P ≤ 0.001.
Figure 3.. ASO1-cEt/DNA inhibits Huh7 cell growth in vitro
(A) ASO1-cEt/DNA is toxic to HCC cells. Representative images of Huh7 cells following NTC, Ctrl-cEt/DNA, or ASO1-cEt/DNA treatment. Scale bar = 200 μm. (B) ASO1-cEt/DNA slows down growth of Huh7 cells. Viable cells were counted using ViaCount with flow cytometry. Huh7 cells were treated with 20 μM ASO by free uptake for the indicated time points. (C) Representative flow-cytometry analysis of dual staining with Annexin V and 7-AAD in Huh7 cells treated with 20 μM ASO by free uptake for 5 days. (D) Quantification of Annexin V-positive cells in panel (C). (E) Western blot analysis of cleaved PARP in Huh7 cells treated as in panel (C). “STS” refers to Huh7 cells treated with 1 μM staurosporine for 4 h, and “Etopo. + Campto.” refers to Huh7 cells treated with 85 μM etoposide and 2 μM camptothecin for 24 h. (F) Representative cell-cycle analysis of propidium iodide DNA staining in Huh7 cells treated with 20 μM ASO by free uptake for 6 days. (G) Quantification of cell-cycle analysis in panel (F); significance refers to the comparison between the G0/G1-population or the G2/M-population. Differences in the S-population were not significant. All data in panels (B-G) represent the average of three independent biological replicates ± SEM. One-way ANOVA was performed with Dunnett’s multiple comparison post-hoc test. * P ≤ 0.05; ** P ≤ 0.01; *** P ≤ 0.001.
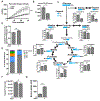
Figure 4.. ASO1-cEt/DNA stimulates pyruvate kinase activity and alters glucose metabolism
(A) Pyruvate kinase activity increases upon ASO1-cEt/DNA treatment. Pyruvate kinase assay was performed after treating Huh7 cells with 20 μM ASO by free uptake for 4 days. Pyruvate kinase (PK) activity was normalized to 5×10⁴ cells. The graph represents the average of three independent biological replicates ± SEM. (B) Levels of lactate released to the medium were measured in Huh7 cells treated with 20 μM ASO by free uptake for 7 days. The medium and ASO were replenished on day 4. LC-MS was conducted on extracted metabolites from the medium after incubating Huh7 cells in medium with [U-13C] glucose for 8 hours on day 7. The levels of lactate release were normalized to the number of cells. (C) ASO1-cEt/DNA alters glucose metabolism. Huh7 cells were treated and processed for LC-MS as in panel (B). Various 13C-containing metabolites are shown, along with their representative isotopologue percentages. (D) ASO1-cEt/DNA increases mitochondrial ATP production rate. Seahorse extracellular flux analysis showing the ratio of mitochondrial ATP production rate (mitoATP) to glycolytic ATP production rate (glycoATP) in Huh7 cells treated with ASO as in panel (B). Production rate refers to pmol ATP/min/103 cells. (E) Detected isotopologues of labeled ATP from [U-13C]-glucose in Huh7 cells treated and processed as in panel (B). (F) Total amount of intracellular ATP detected in Huh7 cells treated and processed as in panel (B), normalized to number of cells. (G) Detected levels of extracellular serine consumed by Huh7 cells processed as in panel (B). Data in panel (B, C, E, F, and G) are the average of 5 independent cultures ± SEM. Data in panel F are the average of 6 independent cultures ± SEM. A linear mixed-effects model was used to determine significance in panel (A). Two-tailed, unpaired t-test was performed in panels (B, C, D, F, and G). * P ≤ 0.05; ** P ≤ 0.01; *** P ≤ 0.001.
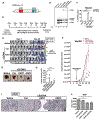
Figure 5.. ASO1-cEt/DNA and ASO2-cEt/DNA inhibit HepG2 cell growth in a xenograft model
(A) Diagram of ASO1-cEt/DNA- and ASO2-cEt/DNA-targeted regions. ASO1-cEt/DNA and ASO2-cET/DNA each target regions (red and blue, respectively) we previously identified (19). ASO2-cEt/DNA also targets a known SRSF3 binding site (yellow)(50). (B) ASO1-cEt/DNA has higher potency than ASO2-cEt/DNA to switch PKM switching in HepG2 cells. Radioactive RT-PCR analysis of RNA from HepG2 cells transfected with 60 nM ASO. (C) Quantification of PKM1 and PKMds isoforms in panel (B). (D) Schematic of ASO dosing schedule in the HepG2 xenograft mouse model. 2×10⁶ HepG2 cells were transplanted on day 0 and allowed to grow for 10 days prior to the first ASO treatment. ASOs (250 mg/kg/wk) were delivered subcutaneously with a weekly schedule of 5-consecutive-day injections, followed by 2 days without injection, for 3 weeks. (E) Whole-animal live imaging of mice with luciferase-integrated HepG2 cells that were orthotopically transplanted in the liver. Luminescence images of transplanted mice on day 3 and day 29 are shown with a color scale from 2×10⁷ (min) – 5×10⁹ (max). A total of 24 mice (N=6 per group) were randomized to each treatment group; one saline-treated mouse died on day 18. (F) Quantification of luciferase signal in panel (E). The average of 5or 6 biological replicates ± SEM is shown. (G) Representative pictures of tumors on day 29. Scale bar = 5 mm. (H) Quantification of tumor volume on day 29. (I) Representative IHC images of Ki67 expression in liver sections with tumors on day 29. Scale bar indicates 50 μm. (J) Quantification of Ki67-positive cells in panel (F). Data in panels (B, C, F, H, and J) are the average of three biological replicates ± SEM. One-way ANOVA was performed with Dunnett’s multiple comparison post-hoc test. * P ≤ 0.05; ** P ≤ 0.01; *** P ≤ 0.001.
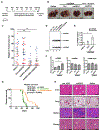
Figure 6.. mASO3-cEt/DNA inhibits tumor growth in a HCC genetic mouse model
(A) Schematic of ASO dosing schedule in the genetic mouse model. Liver tumors were induced by introducing Sleeping Beauty transposase and c-Myc plasmids via hydrodynamic tail-vein injection on day 0. Liver tumors were allowed to grow for 28 days prior to the first mouse-specific ASO (mASO3-cEt/DNA) treatment. mASOs (250 mg/kg/wk) were delivered subcutaneously with a weekly schedule of 5-consecutive day injections, followed by 2 days without injections, for 3 weeks. (B) Representative pictures of livers with tumors on day 47. Scale bar = 5 mm. (C) Measurements of tumor weight normalized to the weight of the whole liver, in different treatment groups on day 47. A total of 80 mice (N=20 per group) were randomized to each treatment group, which includes 10 male (blue dots) and 10 female (red dots) mice. The average of 20 biological replicates ± SEM is shown. (D) mASO3-cEt/DNA induces mPKM splice-switching in liver tumors, as shown in the representative autoradiograph. Radioactive RT-PCR was performed on liver-tumor samples from tumor-bearing mice on day 47. (E) Quantification of mPKM1 and mPKMds isoforms in panel (D). The bar chart is the average of three biological replicates ± SEM. (F) RT-qPCR quantitation of the indicated transcripts upon mASO3-cEt/DNA treatment as in panel (D). All tested transcripts were normalized to the mHPRT transcript level. Relative expression to saline treatment is shown. (G) mASO3-cEt/DNA extends the survival of liver-tumor-bearing mice. Mice (N=42) were randomized in each treatment group, which includes 7 male and 7 female mice. Log-rank test was performed with Bonferroni-corrected threshold (P = 0.0166). Saline-treated mice (black) had a median survival of 45 days; Ctrl-cEt/DNA-treated mice (green) had a median survival of 45.5 days (P = 0.9240); and mASO3-cEt/DNA-treated mice (orange) had a median survival of 61.5 days (P = 0.0001). (H) Representative H&E-stained histologic sections of organs from mice treated as indicated in panel (A). 1a-1c shows stained sections of normal liver; the central veins (*), hepatocytes, hepatic plates, and portal triads are normal in all treatments. 2a-2c shows stained sections of normal lung; alveoli (arrowheads) are clear and normal, and blood vessels (black arrows) are of normal size, distribution, and structure. 3a-3c shows stained sections of normal spleen; white pulp (white arrow) and red pulp (black arrows) are of normal size, structure, ratio, cellularity, and cell composition. 4a-4c shows stained sections of normal kidneys; glomeruli (black arrows) are normal in size, structure, and distribution; tubules (white arrows) have no evidence of degeneration or damage; no lesions were seen in any other organs examined. Scale bar = 200 μm. One-way ANOVA was performed with Dunnett’s multiple comparison post-hoc test in panels (C, D, and F). * P ≤ 0.05; ** P ≤ 0.01; *** P ≤ 0.001.
Figure 7.. Survival analysis for PKM1 and PKM2 isoforms in the LIHC cohort of TCGA.
(A) The violin plot shows the distributions of PSI values of PKM1 (green) and PKM2 (blue) in adjacent-normal and tumor samples, respectively. The survival plots show overall survival (B and C) and recurrent-free survival (D and E), as well as risk group, hazard ratio (HR), log-rank p value, and the total number of patient samples (N) by categorizing patients into high and low groups, based on the median PSI values. Risk group indicates whether the high or low group has worse survival outcome.
Similar articles
- PKM splice-switching ASOs induce upregulation of dual-specificity phosphatases and dephosphorylation of ERK1/2 in hepatocellular carcinoma.
Voss DM, Kral AJ, Sim G, Utama R, Lin KT, Cizmeciyan C, Schafer B, Cunniff PJ, Vakoc CR, Caruthers MH, Mishra L, Krainer AR. Voss DM, et al. J Biol Chem. 2025 Apr;301(4):108345. doi: 10.1016/j.jbc.2025.108345. Epub 2025 Feb 22. J Biol Chem. 2025. PMID: 39993527 Free PMC article. - Dietary-phytochemical mediated reversion of cancer-specific splicing inhibits Warburg effect in head and neck cancer.
Yadav S, Bhagat SD, Gupta A, Samaiya A, Srivastava A, Shukla S. Yadav S, et al. BMC Cancer. 2019 Nov 1;19(1):1031. doi: 10.1186/s12885-019-6257-1. BMC Cancer. 2019. PMID: 31675998 Free PMC article. - No evidence for a shift in pyruvate kinase PKM1 to PKM2 expression during tumorigenesis.
Bluemlein K, Grüning NM, Feichtinger RG, Lehrach H, Kofler B, Ralser M. Bluemlein K, et al. Oncotarget. 2011 May;2(5):393-400. doi: 10.18632/oncotarget.278. Oncotarget. 2011. PMID: 21789790 Free PMC article. - Turning on a fuel switch of cancer: hnRNP proteins regulate alternative splicing of pyruvate kinase mRNA.
Chen M, Zhang J, Manley JL. Chen M, et al. Cancer Res. 2010 Nov 15;70(22):8977-80. doi: 10.1158/0008-5472.CAN-10-2513. Epub 2010 Oct 26. Cancer Res. 2010. PMID: 20978194 Free PMC article. Review. - The Regulatory Network of hnRNPs Underlying Regulating PKM Alternative Splicing in Tumor Progression.
Li Y, Zhang S, Li Y, Liu J, Li Q, Zang W, Pan Y. Li Y, et al. Biomolecules. 2024 May 9;14(5):566. doi: 10.3390/biom14050566. Biomolecules. 2024. PMID: 38785973 Free PMC article. Review.
Cited by
- HNRNPC modulates PKM alternative splicing via m6A methylation, upregulating PKM2 expression to promote aerobic glycolysis in papillary thyroid carcinoma and drive malignant progression.
Rong S, Dai B, Yang C, Lan Z, Wang L, Xu L, Chen W, Chen J, Wu Z. Rong S, et al. J Transl Med. 2024 Oct 8;22(1):914. doi: 10.1186/s12967-024-05668-9. J Transl Med. 2024. PMID: 39380010 Free PMC article. - PKM splice-switching ASOs induce upregulation of dual-specificity phosphatases and dephosphorylation of ERK1/2 in hepatocellular carcinoma.
Voss DM, Kral AJ, Sim G, Utama R, Lin KT, Cizmeciyan C, Schafer B, Cunniff PJ, Vakoc CR, Caruthers MH, Mishra L, Krainer AR. Voss DM, et al. J Biol Chem. 2025 Apr;301(4):108345. doi: 10.1016/j.jbc.2025.108345. Epub 2025 Feb 22. J Biol Chem. 2025. PMID: 39993527 Free PMC article. - Nudix Hydrolase 13 Impairs the Initiation of Colorectal Cancer by Inhibiting PKM1 ADP-Ribosylation.
Lin J, Yin Y, Cao J, Zou B, Han K, Chen Y, Li S, Huang C, Chen J, Lv Y, Xu S, Xie D, Wang F. Lin J, et al. Adv Sci (Weinh). 2025 Apr;12(13):e2410058. doi: 10.1002/advs.202410058. Epub 2025 Feb 8. Adv Sci (Weinh). 2025. PMID: 39921866 Free PMC article. - Protein isoform-centric therapeutics: expanding targets and increasing specificity.
Kjer-Hansen P, Phan TG, Weatheritt RJ. Kjer-Hansen P, et al. Nat Rev Drug Discov. 2024 Oct;23(10):759-779. doi: 10.1038/s41573-024-01025-z. Epub 2024 Sep 4. Nat Rev Drug Discov. 2024. PMID: 39232238 Review. - RBM25 is required to restrain inflammation via ACLY RNA splicing-dependent metabolism rewiring.
Zhang Y, Gao Y, Wang Y, Jiang Y, Xiang Y, Wang X, Wang Z, Ding Y, Chen H, Rui B, Huai W, Cai B, Ren X, Ma F, Xu S, Zhan Z, Liu X. Zhang Y, et al. Cell Mol Immunol. 2024 Nov;21(11):1231-1250. doi: 10.1038/s41423-024-01212-3. Epub 2024 Sep 9. Cell Mol Immunol. 2024. PMID: 39251781
References
- Sung H, Ferlay J, Siegel RL, Laversanne M, Soerjomataram I, Jemal A, et al. Global Cancer Statistics 2020: GLOBOCAN Estimates of Incidence and Mortality Worldwide for 36 Cancers in 185 Countries. CA Cancer J Clin. 2021;71:209–49. - PubMed
- Llovet JM, Kelley RK, Villanueva A, Singal AG, Pikarsky E, Roayaie S, et al. Hepatocellular carcinoma. Nature Reviews Disease Primers. 2021;7:6. - PubMed
- Hanahan D, Weinberg RA. Hallmarks of cancer: the next generation. Cell. 2011;144:646–74. - PubMed
- Noguchi T, Yamada K, Inoue H, Matsuda T, Tanaka T. The L- and R-type isozymes of rat pyruvate kinase are produced from a single gene by use of different promoters. J Biol Chem. 1987;262:14366–71. - PubMed
Publication types
MeSH terms
Substances
LinkOut - more resources
Full Text Sources
Other Literature Sources
Medical
Miscellaneous


