Unique mobile elements and scalable gene flow at the prokaryote-eukaryote boundary revealed by circularized Asgard archaea genomes - PubMed (original) (raw)
Unique mobile elements and scalable gene flow at the prokaryote-eukaryote boundary revealed by circularized Asgard archaea genomes
Fabai Wu et al. Nat Microbiol. 2022 Feb.
Abstract
Eukaryotic genomes are known to have garnered innovations from both archaeal and bacterial domains but the sequence of events that led to the complex gene repertoire of eukaryotes is largely unresolved. Here, through the enrichment of hydrothermal vent microorganisms, we recovered two circularized genomes of Heimdallarchaeum species that belong to an Asgard archaea clade phylogenetically closest to eukaryotes. These genomes reveal diverse mobile elements, including an integrative viral genome that bidirectionally replicates in a circular form and aloposons, transposons that encode the 5,000 amino acid-sized proteins Otus and Ephialtes. Heimdallaechaeal mobile elements have garnered various genes from bacteria and bacteriophages, likely playing a role in shuffling functions across domains. The number of archaea- and bacteria-related genes follow strikingly different scaling laws in Asgard archaea, exhibiting a genome size-dependent ratio and a functional division resembling the bacteria- and archaea-derived gene repertoire across eukaryotes. Bacterial gene import has thus likely been a continuous process unaltered by eukaryogenesis and scaled up through genome expansion. Our data further highlight the importance of viewing eukaryogenesis in a pan-Asgard context, which led to the proposal of a conceptual framework, that is, the Heimdall nucleation-decentralized innovation-hierarchical import model that accounts for the emergence of eukaryotic complexity.
© 2022. The Author(s).
Conflict of interest statement
The authors declare no competing interests.
Figures
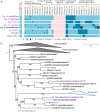
Fig. 1. Complete genomes of Ca. Heimdallarchaeum spp. provide insights for eukaryogenesis.
a, Illustration depicting the enrichment procedure of a microbial community associated with a barite-rich rock no. NA091-45R retrieved from the southern Pescadero Basin Auka hydrothermal vent field at a water depth of 3,700 m. Successive transfers of rock and media (mixed) retained the Ca. H. endolithica while lactate-supplemented enrichment media alone (planktonic) did not. A similar strategy was used to enrich for Ca. H. aukensis from the nearby sediment, substituting alkanes for lactate. b, Maximum-likelihood phylogeny of 57 Heimdall group Asgard archaea based on 76 concatenated archaeal marker genes. The two circular genomes of Ca. Heimdallarchaeum spp. are highlighted in purple. AB_125 in bold is a MAG initially described that represents the clade. c, A schematic illustration depicting cytoplasmic SHY and MBH operons encoded by Ca. Heimdallarchaeum spp. (top) and their hypothetical roles in hydrogen-based syntrophy during eukaryogenesis (bottom). For SHY operons, the four required subunits are followed by a maturation protease. For MBH operon, the electron transport genes are in blue and the maturation factors in purple. The rectangle depicts an ancient archaeon related to the Ca. Heimdallarchaeum; the kidney shapes depict ancient bacteria that may have formed syntrophic relations with the archaeon extracellularly or intracellularly and ultimately evolved into mitochondria. d, Maximum-likelihood phylogeny of Asgard archaea representatives based on a concatenation of 56 archaea–eukaryote markers from 40 genomes showing the relationship with eukaryotes followed by select genome characteristics, marker gene coverage and the presence/absence of genes encoding TCA cycle enzymes, eukaryotic signature proteins and ester-linked lipid synthesis. The genomes constructed in this study are coloured purple, with the circularized genomes indicated in bold italic. Presence/absence and gene copy number are colour-coded. α-KG, α-ketoglutarate; NA, not applicable; OAA, oxaloacetate. For b and d, A list of genomes and markers can be found in Supplementary Tables 8, 16 and 17. Source data
Fig. 2. Circular Heimdallarchaeum genomes reveal abundant repeats belonging to complex networks of transposases/integrases and CRISPR–Cas operons.
a, Representation of the circularized genomes of Ca. H. endolithica and Ca. H. aukensis where the black bars in the outer rings denote non-tandem repeat sequences identified using a cut-off of 100 bp alignment length and 95% sequence identity. Inner networks connect the transposases/integrases belonging to the same family, with the copy numbers of each family (a–k) shown in the bar chart using the same colour scheme. b, Schematic showing the genomic distribution of CRISPR–Cas operons (C1–C7) and intragenic tandem repeats (ig1–3) across the two circular genomes of Heimdallarchaeum spp. c, Alignment score matrix clustering of diverse transposases/integrases showing their evolutionary exchange across archaeal and bacterial domains. Each marker represents a sequence that has been colour-coded by its taxonomic affiliation with the Bacteria domain in pink and the Archaea domain in blue. Highlighted in the open circles are the identified transposases/integrases associated with Heimdallarchaeota, Gerdarchaeota, Lokiarchaeota and Thorarchaeota. d, The specific operon structures of CRISPR–Cas and their mobile element signatures, including integration at tRNA genes (C3 and C4) and complete local displacement (C5 and C6), are shown to the right. The text in the purple boxes indicates the Cas operon types; the numbers in the grey boxes denote the number of repeats. Yellow indicates neighbouring unconserved genes; blue indicates flanking sequences conserved between two Ca. Heimdallarchaeum genomes.
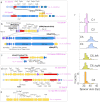
Fig. 3. Unique Heimdallarchaeal mobile elements with viral and transposable features.
a, CRISPR-targeted mobile elements in the two Heimdallarchaeum genomes with viral features (HeimV1 and HeimV2) and without viral features (HeimM1 and HeimM2). The orange/black solid/dashed lines highlight connections between the CRISPR spacers recovered from two geographically distant vent sites in the Gulf of California (Pescadero and Guaymas Basins) to their matching target (protospacers) within the two genomes derived from Pescadero. b–e, Gene synteny of HeimM1 and HeimM2, with legend as shown in c. All tRNA genes were annotated with amino acid abbreviations followed by their anticodon, for example, GlyCCC. b, HeimM1 was integrated next to C2 Cas gene operon and is targeted by a pair of C1 CRISPR spacers. c, HeimM2 contains a repeat peptide-encoding gene that was targeted by a Pescadero Basin spacer. d, HeimV2 was compared with its related transposons discovered in this study—aloposons. e, HeimV1 was compared with two other MAGs belonging to different clades within the Heimdall group. f, Left, normalized sequencing coverage around HeimV1, highlighted in the blue background. Light pink and dark pink show single- and paired-end sequencing on the same DNA sample; grey shows the paired-end sequencing data of a second DNA sample from a different culture. The dashed line highlights the V shape, a signature of the bidirectionally self-replicating circular virus genome. Each dot is an average value binned at a 1 kb interval. Right, illustration depicting the integrated (bottom) and replicating (top) circular states indicated by the plot on the left. The arrows indicate the genomic integration next to the tRNA gene GlyCCC by a viral integrase.
Fig. 4. Gene phylogeny of Heimdallarchaeal viruses and other mobile elements.
a–d, Maximum-likelihood analyses showing the evolutionary relationship between the proteins encoded by the viral-like mobile elements HeimV1 and HeimV2 (bold black, marked by a blue star) with known viruses (magenta), bacteria (green), archaea (blue) and sequences from the Pescadero and Guaymas Basins metagenome assemblies (black). Highlighted with blue backgrounds are viruses with identified hosts. Bootstrap values are listed. The numbers of proteins selected for the phylogenetic analyses are 172 (a), 142 (b), 285 (c) and 87 (d). The serial numbers of the microbial and viral genomes are indicated in the figures and source data files. e, Schematic representation of the 56 contigs from the mobile elements targeting Heimdallarchaea mapped to the closest known homologues in bacteria (pink), archaea (teal) or viruses (purple) through protein orthologue analyses using eggNOG v.5.0. MGE contigs are ranked by size from large (44 kbp) to small (2.8 kbp) and concatenated. The percentages of each taxonomic group measured in the total gene lengths are indicated. Source data
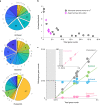
Fig. 5. Functional and taxonomic profiling of gene content cross Asgard archaea.
a, COG classification of genes within the Asgard archaea subdivided into closest taxonomic groups using eggNOG. The expanded wedges in each pie chart highlight the top categories preferentially enriched in the taxonomic group than other groups. They respectively indicate translation (J), transcription (K), replication and repair (L), energy production and conversion (C), the metabolism and transport of amino acids (E), carbohydrates (G) and inorganic ions (P), intracellular trafficking and secretion (U) and cytoskeleton (Z) and protein modification (O). The remaining groups can be found in Tatusov et al.. The numbers indicate the percentages. Note that proteins with unknown function are excluded from each pie chart. b, The archaeal:bacterial gene ratio decreases with increasing genome size in both Asgard archaea (this study) and eukaryotes (data from Alvarez-Ponce et al.). c, Numbers of genes related to different taxonomic groups in relation to the total number of genes in the representative genomes of the Asgard archaea indicate different scaling properties. The solid lines represent the linear fit of the data. The dashed lines represent the extrapolated base number of archaeal genes. Unassigned means that no homology was found in the genome database. Inset, Expanded view of the genes encoding ERPs. Source data
Fig. 6. Distribution of ERP genes and the hypothesized HDH model for eukaryotic origin.
a, Presence of various ERP gene families across the selected representatives as shown in Fig. 1d, which belong to five candidate Asgard archaeal phyla—Heimdallarchaeota, Gerdarchaeota, Lokiarchaeota, Thorarchaeota and Odinarchaeota. Inset, Total gene numbers belonging to the gene families shown in a. b, Venn diagrams showing the ERP gene families shared between lineages of different phylogenetic distances, including three circular genomes (left), two Thorarchaeota members related at the family level (middle) and two members of the Lokiarchaeota related at the family level (right). c, The proposed HDH model provides a conceptual framework for the process of genome acquisition during early eukaryotic evolution. Key steps include a Heimdall-like ancestral archaeon with a simple genome engaged in endosymbiosis with a bacterium to establish the FECA. FECA then acquired innovations across the tree of life via an extensive gene import, most frequently, and often indirectly, through close closely related Asgard archaea, to ultimately orchestrate the LECA. The pink arrows indicate several major phases during early eukaryotic evolution. The dark arrows indicate horizontal transfer events from or via Asgard archaea into the eukaryotic genomes. The grey arrows indicate other horizontal transfer events that occurred and contributed to the eukaryotic genomes, although to a lesser extent. Source data
Extended Data Fig. 1. The emergence of Ca. Heimdallarchaeum endolithica belonging to the Ancient Archaea Group of Heimdallarchaeota in a series of incubations derived from the same rock originated from Pescadero basin.
a. Maximum fraction of the AAG phylotype within the first-generation incubations from the rock detected within a 13-month period. b. Maximum fraction of the AAG phylotype within the serial dilution cultures of the initial lactate-fed culture. c. Amplicon sequencing of a hypervariable region in 16S rRNA gene showing the fraction of AAG phylotype in second-generation lactate-fed cultures. Mixed, mixture of rock and medium transferred from the first-generation incubation. Planktonic, only top-layer medium was transferred. d. Community complexity reduction over time as indicated by total operational taxonomic unit (OTU) counts (top) and the Shannon diversity index (bottom). e. Full-length 16S rRNA gene survey using universal archaea primers showing a single abundant AAG phylotype (Ca. Heimdallarchaeum endolithica) species above noise, and its 16S sequence dissimilarity (percent sequence identity difference) with other archaea in the community. Loki, a Lokiarchaeota phylotype; Thermopl, a Thermoplasmatota phylotype; Woese, a Woesearchaeia phylotype. f. Wide-field microscopy images of a large multispecies biofilm isolated from the lactate-fed 2nd-generation incubation, which was stained using DAPI (DNA), FM1-43 (membrane lipids), and concanavalin A (extracellular matrix). Imaging was repeated two times with similar observations. In c and d, error bars indicate SD. N=2, independent DNA samples extracted from the same incubation. Source data
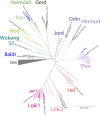
Extended Data Fig. 2. Maximum-likelihood analyses of 282 Asgard Archaea MAGs and genomes rooted using 15 TACK archaea.
The different clades are labeled in different colors, with clade names indicated in the same color. MAGs selected for detailed phylogenomics analyses are annotated, with published ones in black and those constructed in this study in bold blue. Jord and Wukong clades do not yet have representatives passing the genome selection filter based on Marker coverage and genome contiguity scores. Detailed descriptions of these genomes can be found in the Supplementary Tables 8 (All Asgard archaea), S9 (Selected Asgard archaea), and S16 (TACK), Markers used can be found in Supplementary Table 17. Source data
Extended Data Fig. 3. Genome-based metabolic predictions of Ca. Heimdallarchaeum spp. and comparisons with other contiguous, near-complete Asgard Archaea MAGs.
a. Illustration of metabolic reconstruction highlighting hydrogen metabolism and tricarboxylic acid (TCA) cycle. Abbreviations: α-KG, α-ketoglutarate; OAA, oxaloacetate; SHY, sulfhydrogenase (cytosolic hydrogenase); MBH, membrane-bound hydrogenase; lac, lactate; carb.hydr., carbohydrate; Pyr, pyruvate; PEP, phosphoenolpyruvate; Ace, acetate; Eth, ethanol. b and c. Enzymes involved in TCA cycle reactions (b) and cytosolic hydrogen evolution (c) in each genome/MAG representatives of Asgard archaea.
Extended Data Fig. 4. Marker determination and phylogeny of expanded representatives of Asgard archaea.
a. Differential distributions of putatively single-copy archaea marker genes in initially selected genomes/MAGs, which show cross-asgard and clade-specific marker coverage features. b. Maximum-likelihood phylogeny of an expanded selection of asgard archaea MAGs in relation to Euryarchaeota, TACK, and Eukaryota. Ca. H. aukensis was omitted to improve evenness in the taxonomic selection here due to its close relation with Ca. H. endolithica. Detailed descriptions of the 51 genomes used in the analyses can be found in Supplementary Tables 9 (Selected Asgard archaea) and S16 (TACK+Eukaryotes). Markers used can be found in Supplementary Table 17. Purple indicates genomes and MAGs constructed in this study. Source data
Extended Data Fig. 5. CRISPR/Cas systems in Ca. Heimdallarchaeum spp.
a-e. Schematic showing the gene synteny of the CRISPR/Cas systems (serial numbers and operon types are in bold pink) and their alignments between the two genomes. Genes conserved between the two genomes are labeled in various shades of blue and purple to assist visualization. Genes only appearing in one of the genomes are in yellow. Red indicates CRISPR arrays. Array sizes are indicated by the number of repeats such as [77x]. In b, The Aloposons with giant genes are also shown to illustrate their site-specific integration. f. Size distribution of spacers in each CRISPR array. Source data
Extended Data Fig. 6. Numbers of sequences homologous to some of the proteins encoded by Heimdallarchaeal viruses HeimV1 and HeimV2.
Magenta stars indicate enrichments in viral database. The homology search was carried out using diamond v2.0.6 using a e-value cutoff of 10-3. ASG, asgard archaea genomes; FWA, in-house metagenomic assemblies of microbial communities in Pescadero basin incubations; PAA, publicly available and published metagenomic assemblies of microbial communities in Guaymas basin sediment; Vir, IMGVR3 viral database; Gtdb, genomic sequences from GTDB v202. See methods and supplementary tables for the details of these datasets. Source data
Extended Data Fig. 7. Giant proteins encoded by Asgard archaea.
a. Gene synteny showing 1) an additional genomic region with truncated, fragmented sequences homologous to one of the giant genes in Aloposons, and 2) tandem giant genes which show high homologies with their neighbors are found in Thorarchaeotes, and are distantly related to one of the two giant genes in Aloposons. b. Giant proteins larger than 3000 a.a. encoded by selected Asgard archaea representatives. In dark grey are part of the Aloposons. Functional domains as identified through conserved domain database (CDD) analyses are indicated on the right. Purple indicates genomes constructed in this study.
Extended Data Fig. 8. Maximum-likelihood analyses of HeimV2 IbrA-like protein.
The branch names are as follows: For viruses, serial numbers followed by viral taxonomy then followed by host taxonomy if available. For microbial genomes, serial numbers followed by taxonomy. In total, 147 proteins were included in the analyses. Source data
Extended Data Fig. 9. Scaling property of gene flow is obscured by fragmented genomes of varying quality.
The plots show the number of Archaea-related genes in relation to the total gene counts in the Asgard archaea genomes. a. only the 8 genomes investigated in detail in this study. All genomes have less than 20 contigs and with verified coverage of all archaeal markers. b. In addition to a, an additional 12 genomes were added (in black), which contain no more than 100 contigs with a loosened completeness scores as shown in Supplementary Table 9. Since marker redundancy differs among lineages, contamination level is hard to assess. c. In addition to b, all other 262 published Asgard archaea genomes were added (in green). This indicates a severe deviation from the invariable relation shown in a, but instead show a near linear relation. This can be understood that in either incomplete or contaminated genomes, all types of genes have equal possibility to be retained. For example, the 1.5Mb Odinarchaeote genome contains the similar number of Archaea-related genes (~900) as a Lokiarchaeote genome sized 4.4Mb. However, if a Lokiarchaeote is fragmented into 300 contigs and only 1.5Mb in total length is randomly binned into a MAG, the latter will roughly contain ~ 300 Archaea-related genes. Hence, the type of relation shown in (a) can only be captured in highly confident, complete genomes. Legend for all panels is shown in c. Source data
Similar articles
- Peculiar morphology of Asgard archaeal cells close to the prokaryote-eukaryote boundary.
Avcı B, Panagiotou K, Albertsen M, Ettema TJG, Schramm A, Kjeldsen KU. Avcı B, et al. mBio. 2025 May 14;16(5):e0032725. doi: 10.1128/mbio.00327-25. Epub 2025 Apr 16. mBio. 2025. PMID: 40237460 Free PMC article. - Inference and reconstruction of the heimdallarchaeial ancestry of eukaryotes.
Eme L, Tamarit D, Caceres EF, Stairs CW, De Anda V, Schön ME, Seitz KW, Dombrowski N, Lewis WH, Homa F, Saw JH, Lombard J, Nunoura T, Li WJ, Hua ZS, Chen LX, Banfield JF, John ES, Reysenbach AL, Stott MB, Schramm A, Kjeldsen KU, Teske AP, Baker BJ, Ettema TJG. Eme L, et al. Nature. 2023 Jun;618(7967):992-999. doi: 10.1038/s41586-023-06186-2. Epub 2023 Jun 14. Nature. 2023. PMID: 37316666 Free PMC article. - Asgard archaea illuminate the origin of eukaryotic cellular complexity.
Zaremba-Niedzwiedzka K, Caceres EF, Saw JH, Bäckström D, Juzokaite L, Vancaester E, Seitz KW, Anantharaman K, Starnawski P, Kjeldsen KU, Stott MB, Nunoura T, Banfield JF, Schramm A, Baker BJ, Spang A, Ettema TJ. Zaremba-Niedzwiedzka K, et al. Nature. 2017 Jan 19;541(7637):353-358. doi: 10.1038/nature21031. Epub 2017 Jan 11. Nature. 2017. PMID: 28077874 - Eukarya the chimera: eukaryotes, a secondary innovation of the two domains of life?
Nobs SJ, MacLeod FI, Wong HL, Burns BP. Nobs SJ, et al. Trends Microbiol. 2022 May;30(5):421-431. doi: 10.1016/j.tim.2021.11.003. Epub 2021 Dec 1. Trends Microbiol. 2022. PMID: 34863611 Review. - Mythical origins of the actin cytoskeleton.
Akıl C, Kitaoku Y, Tran LT, Liebl D, Choe H, Muengsaen D, Suginta W, Schulte A, Robinson RC. Akıl C, et al. Curr Opin Cell Biol. 2021 Feb;68:55-63. doi: 10.1016/j.ceb.2020.08.011. Epub 2020 Oct 10. Curr Opin Cell Biol. 2021. PMID: 33049465 Review.
Cited by
- Looking through the Lens of the Ribosome Biogenesis Evolutionary History: Possible Implications for Archaeal Phylogeny and Eukaryogenesis.
Jüttner M, Ferreira-Cerca S. Jüttner M, et al. Mol Biol Evol. 2022 Apr 11;39(4):msac054. doi: 10.1093/molbev/msac054. Mol Biol Evol. 2022. PMID: 35275997 Free PMC article. - Asgard archaea modulate potential methanogenesis substrates in wetland soil.
Valentin-Alvarado LE, Appler KE, De Anda V, Schoelmerich MC, West-Roberts J, Kivenson V, Crits-Christoph A, Ly L, Sachdeva R, Greening C, Savage DF, Baker BJ, Banfield JF. Valentin-Alvarado LE, et al. Nat Commun. 2024 Jul 31;15(1):6384. doi: 10.1038/s41467-024-49872-z. Nat Commun. 2024. PMID: 39085194 Free PMC article. - Three families of Asgard archaeal viruses identified in metagenome-assembled genomes.
Medvedeva S, Sun J, Yutin N, Koonin EV, Nunoura T, Rinke C, Krupovic M. Medvedeva S, et al. Nat Microbiol. 2022 Jul;7(7):962-973. doi: 10.1038/s41564-022-01144-6. Epub 2022 Jun 27. Nat Microbiol. 2022. PMID: 35760839 Free PMC article. - Identification of key steps in the evolution of anaerobic methanotrophy in Candidatus Methanovorans (ANME-3) archaea.
Woods PH, Speth DR, Laso-Pérez R, Utter DR, Ruff SE, Orphan VJ. Woods PH, et al. Sci Adv. 2025 Jun 20;11(25):eadq5232. doi: 10.1126/sciadv.adq5232. Epub 2025 Jun 20. Sci Adv. 2025. PMID: 40540566 Free PMC article. - Actin cytoskeleton and complex cell architecture in an Asgard archaeon.
Rodrigues-Oliveira T, Wollweber F, Ponce-Toledo RI, Xu J, Rittmann SKR, Klingl A, Pilhofer M, Schleper C. Rodrigues-Oliveira T, et al. Nature. 2023 Jan;613(7943):332-339. doi: 10.1038/s41586-022-05550-y. Epub 2022 Dec 21. Nature. 2023. PMID: 36544020 Free PMC article.
References
- Hug LA, et al. A new view of the tree of life. Nat. Microbiol. 2016;1:16048. - PubMed
- Zaremba-Niedzwiedzka K, et al. Asgard archaea illuminate the origin of eukaryotic cellular complexity. Nature. 2017;541:353–358. - PubMed
- Spang A, et al. Proposal of the reverse flow model for the origin of the eukaryotic cell based on comparative analyses of Asgard archaeal metabolism. Nat. Microbiol. 2019;4:1138–1148. - PubMed
Publication types
MeSH terms
Substances
LinkOut - more resources
Full Text Sources


