In silico analyses of blood flow and oxygen transport in human micro-veins and valves - PubMed (original) (raw)
In silico analyses of blood flow and oxygen transport in human micro-veins and valves
Navaneeth Krishna Rajeeva Pandian et al. Clin Hemorheol Microcirc. 2022.
Abstract
Background: Almost 95% of the venous valves are micron scale found in veins smaller than 300μm diameter. The fluid dynamics of blood flow and transport through these micro venous valves and their contribution to thrombosis is not yet well understood or characterized due to difficulty in making direct measurements in murine models.
Objective: The unique flow patterns that may arise in physiological and pathological non-actuating micro venous valves are predicted.
Methods: Computational fluid and transport simulations are used to model blood flow and oxygen gradients in a microfluidic vein.
Results: The model successfully recreates the typical non-Newtonian vortical flow within the valve cusps seen in preclinical experimental models and in clinic. The analysis further reveals variation in the vortex strengths due to temporal changes in blood flow. The cusp oxygen is typically low from the main lumen, and it is regulated by systemic venous flow.
Conclusions: The analysis leads to a clinically-relevant hypothesis that micro venous valves may not create a hypoxic environment needed for endothelial inflammation, which is one of the main causes of thrombosis. However, incompetent micro venous valves are still locations for complex fluid dynamics of blood leading to low shear regions that may contribute to thrombosis through other pathways.
Keywords: Micro venous valve; non-newtonian blood flow; vortex; wall shear stress.
Figures
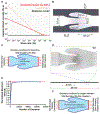
Fig. 1.
Modelling blood flow in venous valves. (A) Variation of viscosity of blood with wall shear rate sweep for different blood viscosity models – Newtonian model (black), Casson model (pink), and generalized power law (red). (B) Image showing the dimensions used for the design of a micro-venous valve (C) Image showing the boundary conditions and inlet conditions used to solve the blood flow problem in micro-venous valve (D) A straight micro vein of 20mm length with three micro venous valves (5mm apart) was designed and discretized. (E) Plot showing the convergence of maximum velocity in a micro-venous valve with increased number of elements. (F) Image showing the boundary conditions and inlet conditions used to solve the oxygen transport problem in a micro-venous valve.
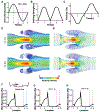
Fig. 2.
Blood flow in venous valves. (A) Contour plot showing velocity streamlines of whole blood flow in venous valve using different viscosity models. (B) Contour plot showing the distribution of dynamic viscosity of whole blood in venous valve when using different viscosity models. (C) Graph comparing the wall shear stress distribution in the venous valve walls when different blood viscosity models are used - Newtonian model (black), Casson model (pink), and generalized power law (red).
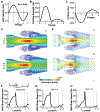
Fig. 3.
Transient analysis of blood flow through the venous valves under low Reynold’s numbers (Re 0.04). (A) Graph showing the transient inlet sinusoidal velocity profile. (B) Graph showing the transient variation of swirling strength of the primary vortex. (C) Graph showing the transient variation of vorticity of the primary vortex. (D) Contour plot showing velocity streamlines of whole blood flow in the venous valves at maximum forward and maximum backward velocity (time points t = 1s, and 3s respectively). (E) Vector plot showing velocity vectors of whole blood flow in the venous valve at maximum forward and maximum backward velocity (time points t = 1s, and 3s respectively). Graphs comparing the variation the wall shear stress distribution in the venous valve walls under (F) steady flow, (G) max forward velocity (t = 1s), and (I) max backward velocity (t = 3s).
Fig. 4.
Transient analysis of blood flow through the venous valves under high Reynold’s numbers (Re 10.00). (A) Graph showing the transient inlet sinusoidal velocity profile. (B) Graph showing the transient variation of swirling strength of the primary vortex. (C) Graph showing the transient variation of vorticity of the primary vortex. (D) Contour plot showing velocity streamlines of whole blood flow in the venous valves at maximum forward and maximum backward velocity (time points t = 1s, and 3s respectively). (E) Vector plot showing velocity vectors of whole blood flow in the venous valve at maximum forward and maximum backward velocity (time points t = 1s, and 3s respectively). Graphs comparing the variation the wall shear stress distribution in the venous valve walls under (F) steady flow, (G) max forward velocity (t = 1s), and (I) max backward velocity (t = 3s).
Fig. 5.
Blood flow simulation in 3D venous valves. (A) The discretized domain of a 3D micro venous valve. Vector plot of the velocity profile at the midplane of the 3D venous valves (Re 0.04), (B) orthogonal view and (C) isometric view. (D) Contour plot of the primary and secondary vortices formed at the 3D venous valve cusps. (E) Contour plot of the wall shear stress distribution.
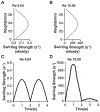
Fig. 6.
3D vortex characterization at venous valves. Graph showing the variation of swirling strength of the primary vortex along the height of the 3D venous valve at (A) Re = 0.04 and (B) Re = 10.00 (red). Graph showing the transient variation of swirling strength of the primary vortex at the 3D venous valve at (C) Re = 0.04 and (D) Re = 10.00.
Fig. 7.
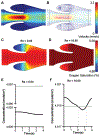
Mass transport of oxygen in the venous valves. (A) Velocity contour and (B) streamline plot of whole blood flow in the venous valves. Contour plot of the distribution of oxygen concentration under different steady flow condition (C) Re = 0.04 and (D) Re = 10.00. Graph showing the transient variation of oxygen concentration at the venous valve cusps for (E) Re = 0.04 and (F) Re = 10.00, under steady flow (grey line) or a transient sinusoidal flow profile (black line).
Similar articles
- Hemodynamics of venous valve pairing and implications on helical flow.
Chen HY, Diaz JA, Lurie F, Chambers SD, Kassab GS. Chen HY, et al. J Vasc Surg Venous Lymphat Disord. 2018 Jul;6(4):517-522.e1. doi: 10.1016/j.jvsv.2018.02.005. J Vasc Surg Venous Lymphat Disord. 2018. PMID: 29909857 - To what extent might deep venous thrombosis and chronic venous insufficiency share a common etiology?
Malone PC, Agutter PS. Malone PC, et al. Int Angiol. 2009 Aug;28(4):254-68. Int Angiol. 2009. PMID: 19648868 Review. - Fluid dynamics of thoracic cavity venous flow in multiple sclerosis.
Tucker T. Tucker T. Med Hypotheses. 2019 Oct;131:109236. doi: 10.1016/j.mehy.2019.109236. Epub 2019 Jul 6. Med Hypotheses. 2019. PMID: 31443776 - Microengineered Human Vein-Chip Recreates Venous Valve Architecture and Its Contribution to Thrombosis.
Rajeeva Pandian NK, Walther BK, Suresh R, Cooke JP, Jain A. Rajeeva Pandian NK, et al. Small. 2020 Dec;16(49):e2003401. doi: 10.1002/smll.202003401. Epub 2020 Nov 17. Small. 2020. PMID: 33205630 Free PMC article. - [Venous valves in the legs: hemodynamic and biological problems and relationship to physiopathology].
Boisseau MR. Boisseau MR. J Mal Vasc. 1997 May;22(2):122-7. J Mal Vasc. 1997. PMID: 9480331 Review. French.
Cited by
- Identification of biological significance of different stages of varicose vein development based on mRNA sequencing.
Shi MJ, Yan Y, Liu F, Zhao JX, Hou F, He SC, Zhang RP, Wang H. Shi MJ, et al. Sci Rep. 2024 Sep 28;14(1):22536. doi: 10.1038/s41598-024-73691-3. Sci Rep. 2024. PMID: 39341975 Free PMC article. - A Potential Role for MAGI-1 in the Bi-Directional Relationship Between Major Depressive Disorder and Cardiovascular Disease.
Banerjee P, Chau K, Kotla S, Davis EL, Turcios EB, Li S, Pengzhi Z, Wang G, Kolluru GK, Jain A, Cooke JP, Abe J, Le NT. Banerjee P, et al. Curr Atheroscler Rep. 2024 Sep;26(9):463-483. doi: 10.1007/s11883-024-01223-5. Epub 2024 Jul 3. Curr Atheroscler Rep. 2024. PMID: 38958925 Review. - Biomechanical Assessment of Red Blood Cells in Pulsatile Blood Flows.
Kang YJ. Kang YJ. Micromachines (Basel). 2023 Jan 26;14(2):317. doi: 10.3390/mi14020317. Micromachines (Basel). 2023. PMID: 36838017 Free PMC article.
References
- Lurie F, Kistner RL, Eklof B, Kessler D. Mechanism of venous valve closure and role of the valve in circulation: a new concept. J Vasc Surg. 2003;38(5):955–61. - PubMed
- Caggiati A, Phillips M, Lametschwandtner A, Allegra C. Valves in small veins and venules. Eur J Vasc Endovasc Surg. 2006;32(4):447–52. - PubMed
- Tien WH, Chen HY, Berwick ZC, Krieger J, Chambers S, Dabiri D, et al. Role of sinus in prosthetic venous valve. Eur J Vasc Endovasc Surg. 2014;48(1):98–104. - PubMed
MeSH terms
Substances
LinkOut - more resources
Full Text Sources
Medical
