Integrin subunit beta 8 contributes to lenvatinib resistance in HCC - PubMed (original) (raw)
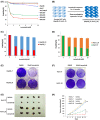
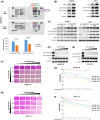
FIGURE 1
Establishment and verification of lenvatinib‐resistant (LR) hepatocellular carcinoma (HCC) cells. (A) The effect of lenvatinib on cell viability of seven HCC cell lines was assessed after 72 hours of treatment using CCK‐8 assay. (B) A schematic model for generating LR cells. (C) Cell viability was evaluated in parental and resistant Hep3B cells by CCK‐8 assay. (D) Cell viability was evaluated in parental and resistant Huh7 cells by CCK‐8 assay. (E) Cell viability was evaluated in parental and resistant Hep3B cells by crystal violet staining. (F) Cell viability was evaluated in parental and resistant Huh7 cells by crystal violet staining. (G) Representative picture of tumors extracted from SCID‐bg mice 21 days after vehicle or lenvatinib (10 mg/kg) treatment. n = 4 mice in each group. (H) Primary tumor size was recorded every 3 days. Values are presented as mean ± SD; **p < 0.01
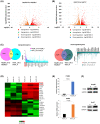
FIGURE 2
Expression of integrin subunit beta 8 (ITGB8) is elevated in LR cells. (A) Volcano plot of differentially expressed genes (Hep3B_LR vs. Hep3B_P). (B) Volcano plot of differentially expressed genes (Huh7_LR vs. Huh7_P). (C) Differentially expressed genes (DEGs) were identified both in Hep3B_LR and Huh7_LR cells compared with their parental counterparts. (D) Heatmap of top 20 DEGs in comparison to Hep3B_LR and Hep3B_P cells. (E) Real‐time polymerase chain reaction (PCR) analysis validated the up‐regulation of ITGB8 messenger RNA (mRNA) level in LR cells. Transcript levels were normalized to β‐actin. (F) Western blot validated the up‐regulation of ITGB8 protein in LR cells. Glyceraldehyde 3‐phosphate dehydrogenase (GAPDH) was used as a loading control. FDR, false discovery rate. ADH5, alcohol dehydrogenase 5; CAP2, cyclase associated actin cytoskeleton regulatory protein 2; CNPY4, canopy FGF signaling regulator 4; COX6B1, cytochrome C oxidase subunit 6B1; CPPED1, calcineurin like phosphoesterase domain containing 1; CTBP1‐DT, CTBP1 divergent transcript; C5, complement C5; EDNRB, endothelin receptor type B; EMP2, epithelial membrane protein 2; EXOC3L4, exocyst complex component 3 like 4; FHDC1, FH2 domain containing 1; FJX1, four‐jointed box kinase 1; GALNT16, polypeptide N‐acetylgalactosaminyltransferase 16; GRWD1, glutamate rich WD repeat containing 1; GTF2F2, general transcription factor IIF subunit 2; INHBB, inhibin subunit beta B; IPP, intracisternal A particle‐promoted polypeptide; ITGB8, integrin subunit beta 8; KALRN, kalirin RhoGEF kinase; KCTD17, potassium channel tetramerization domain containing 17; LAD1, ladinin 1; LINC00941, long intergenic non‐protein coding RNA 941; LPAR2, lysophosphatidic acid receptor 2; MAP1B, microtubule associated protein 1B; MBTD1, Mbt domain containing 1; MRPL2, mitochondrial ribosomal protein L2; MYBPC3, myosin binding protein C3; NDC80, NDC80 kinetochore complex component; NRARP, NOTCH regulated ankyrin repeat protein; PCSK5, proprotein convertase subtilisin/kexin type 5; PDE4B, phosphodiesterase 4B; PHF5A, PHD finger protein 5A; RAB9B, ras‐related protein rab‐9B; RBBP5, RB binding protein 5; ROBO3, roundabout guidance receptor 3; SCNN1A, sodium channel epithelial 1 subunit alpha; SESN2, sestrin 2; SFRP4, secreted frizzled related protein 4; SFXN3, sideroflexin 3; SH3BP5L, SH3 binding domain protein 5 like; SLC39A8, solute carrier family 39 member 8; STXBP6, syntaxin binding protein 6; SUCNR1, succinate receptor 1; TIMP3, TIMP metallopeptidase inhibitor 3; TMEM65, transmembrane protein 65; TRABD2B, TraB domain containing 2B; XDH, xanthine dehydrogenase; ZNF579, zinc finger protein 579; ZYG11A, Zyg‐11 family member A, cell cycle regulator
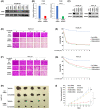
FIGURE 3
Targeting ITGB8 overcomes lenvatinib resistance in vitro and in vivo. (A) Western blot analysis of ITGB8 knockdown efficiency of five ITGB8‐targeting short hairpin RNAs (shRNAs) following transient transfection of Hep3B_LR cells. GAPDH was used as a loading control. (B) Real‐time PCR analysis of ITGB8‐shRNA1 and ITGB8‐shRNA3 LR cells. Transcript levels were normalized to β‐actin expression. (C) Western blot analysis of ITGB8 knockdown efficiency in LR cells after lentiviral transduction of two independent ITGB8 shRNAs 7 days after puromycin selection. GAPDH was used as a loading control. (D, E) Sulforhodamine B (SRB) assay of cell viability of nontargeting control (Ctrl shRNA) and ITGB8 shRNA stable knockdown Hep3B_LR cells: representative pictures (D) and Qualification (E). (F,G) SRB assay of cell viability of Ctrl shRNA and ITGB shRNA stable knockdown Huh7_LR cells using the SRB assay: representative pictures (F) and qualification (G). (H) Representative pictures of tumors extracted from SCID‐bg mice 21 days after vehicle or lenvatinib (10 mg/kg) treatment. n = 5 mice in each group. (I) Primary tumor size was measured every 3 days. Values are presented as mean ± SD; **p < 0.01, ***p < 0.001
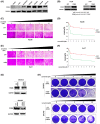
FIGURE 4
ITGB8 is overexpressed in HCC cells with intrinsic lenvatinib resistance, which is reversed by ITGB8 knockdown. (A) Western blot analysis of ITGB8 basal expression in seven HCC cell lines. GAPDH was used as a loading control. (B) Western blot analysis of ITGB8 expression in Hep3B and Huh7 cells with transduction of pLenti6.3/V5‐DEST–green fluorescent protein (GFP) or pLenti6.3/V5‐DEST‐ITGB8 lentiviral particles. (C, D) Cell viability was evaluated in Hep3B cells with stable overexpression of GFP (control) or ITGB8 using the SRB assay: representative pictures (C) and quantification (D). (E, F) Cell viability was evaluated in Huh7 cells with stable overexpression of GFP or ITGB8 using the SRB assay: representative pictures (E) and quantification (F). (G) Expression of ITGB8 was examined by western blot in control or ITGB8 stably knockdown SNU423 and SNU449 cells. (H) Cell viability was evaluated in control or ITGB8 stably knockdown SNU423 and SNU449 cells by crystal violet staining
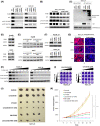
FIGURE 5
ITGB8 overexpression promotes lenvatinib resistance in HCC cells through the activation of the AKT signaling pathway. (A) Phospho‐kinase antibody array blots using whole cell lysates of Ctrl shRNA and ITGB8 shRNA stably knockdown Hep3B_LR cells. Phospho‐AKT(Thr308), phospho‐AKT(Ser473), and phospho‐p53(S15/S46/S392) are marked in rectangles. (B) Western blot analysis of parental and LR cells for ITGB8, AKT, p‐AKT (Thr308), p‐AKT (Ser473), and GAPDH. (C) Western blot analysis of GFP control and ITGB‐overexpressing cells for ITGB8, AKT, p‐AKT (Thr308), p‐AKT (Ser473), and GAPDH. (D) Western blot analysis of Hep3B_LR cells treated MK‐2206 for AKT, p‐AKT (Thr308), p‐AKT (Ser473), and GAPDH. (E) Western blot analysis of Huh7_LR cells treated MK‐2206 for AKT, p‐AKT (Thr308), p‐AKT (Ser473), and GAPDH. (F, G) Cell viability was evaluated and qualified in Hep3B_LR cells co‐treated with MK‐2206 and lenvatinib by SRB assay. (H, I) Cell viability was evaluated and qualified in Huh7_LR cells co‐treated with MK‐2206 and lenvatinib by SRB assay
FIGURE 6
ITGB8 up‐regulation increases AKT expression and activation through increased expression of HSP90 in LR cells. (A) Western blot analysis of ITGB8 knockdown LR cells for ITGB8, AKT, p‐AKT (Thr308), p‐AKT (Ser473), and GAPDH. (B) Western blot analysis of tissue lysate from tumors (Figure 3H) for ITGB8, AKT, and p‐AKT (Thr308), and p‐AKT (Ser473). GAPDH as a loading control. (C) Immunoprecipitation AKT and western blot analysis of ubiquitin and AKT. GAPDH was used as an input control. (D) Western blot analysis of parental and LR cells for ITGB8, HSP90, and GAPDH. (E) Western blot analysis of GFP control and ITGB‐overexpression cells for ITGB8, HSP90, and GAPDH. (F) Western blot analysis of ITGB8 knockdown LR cells for HSP90 and GAPDH. (G) Immunofluorescence analysis of ITGB8, HSP90, and AKT in tissue from Huh7_LR xenograft tumors (Figure 3H). Nuclei were stained with 4´,6‐diamidino‐2‐phenylindole (blue). (H) Western blot analysis of AKT and p‐AKT (Thr308) and p‐AKT (Ser473) at the selected concentration of 17‐AAG in LR cells. GAPDH was used as a loading control. (I) Cell viability was evaluated in LR cells co‐treated with 17‐AAG and lenvatinib using crystal violet staining. (J) Representative pictures of tumors extracted from NSG‐A2 mice 14 days after single or combination treatment for 2 weeks. (K) Tumor measurements of xenograft mice treated with lenvatinib, MK‐2206, and 17‐AAG. Values are presented as mean ± SD; **p < 0.01, ***p < 0.001
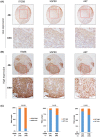
FIGURE 7
ITGB8, HSP90, and AKT expression are positively correlated in HCC specimens. (A) Representative immunohistochemistry (IHC) images of low expression of ITGB8, AKT, and HSP90. (B) Representative IHC images of high expression of ITGB8, AKT, and HSP90. (C) Correlation analysis of all HCC tissue microarray tissues between ITGB8 and HSP90, ITGB8 and AKT, and HSP90 and AKT
FIGURE 8
A schematic model for ITGB8‐mediated lenvatinib resistance in HCC. Lenvatinib treatment kills HCC cells and suppresses HCC development. However, HCC cells acquire resistance to lenvatinib treatment by increasing the expression of ITGB8. ITGB8 increases the expression of HSP90, which stabilizes AKT expression and enhances AKT activity, thus leading to lenvatinib resistance. In support of this model, functional inhibition of ITGB8 by shRNA, AKT inhibitor MK‐2206, or HSP90 inhibitor 17‐AAG resensitizes LR HCC cells to lenvatinib treatment. TMA, tissue microarray
