On the stratospheric chemistry of midlatitude wildfire smoke - PubMed (original) (raw)
. 2022 Mar 8;119(10):e2117325119.
doi: 10.1073/pnas.2117325119. Epub 2022 Mar 1.
Kimberlee Dube 2, Kane Stone 1, Pengfei Yu 3, Doug Kinnison 4, Owen B Toon 5, Susan E Strahan 6, Karen H Rosenlof 7, Robert Portmann 7, Sean Davis 7, William Randel 4, Peter Bernath 8 9, Chris Boone 8, Charles G Bardeen 4, Adam Bourassa 2, Daniel Zawada 2, Doug Degenstein 2
Affiliations
- PMID: 35238658
- PMCID: PMC8915979
- DOI: 10.1073/pnas.2117325119
On the stratospheric chemistry of midlatitude wildfire smoke
Susan Solomon et al. Proc Natl Acad Sci U S A. 2022.
Abstract
SignificanceLarge wildfires have been observed to inject smoke into the stratosphere, raising questions about their potential to affect the stratospheric ozone layer that protects life on Earth from biologically damaging ultraviolet radiation. Multiple observations of aerosol and NO2 concentrations from three independent satellite instruments are used here together with model calculations to identify decreases in stratospheric NO2 concentrations following major Australian 2019 through 2020 wildfires. The data confirm that important chemistry did occur on the smoke particle surfaces. The observed behavior in NO2 with increasing particle concentrations is a marker for surface chemistry that contributes to midlatitude ozone depletion. The results indicate that increasing wildfire activity in a warming world may slow the recovery of the ozone layer.
Keywords: chemistry; smoke; stratospheric ozone; wildfire.
Conflict of interest statement
The authors declare no competing interest.
Figures
Fig. 1.
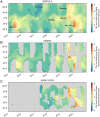
Monthly mean lower stratospheric aerosol extinction observations at around 750 nm (defined as the ratio to gas phase molecules only), available since 2015 from OMPS (A), OSIRIS (B), and SAGE III/ISS (C). Data represent an average for the lower stratosphere, weighted by the microwave limb sounder temperature weighting function, which is centered around 100 mb or about 16-km altitude (50). The year 2015 is selected as the start date to capture the Calbuco eruption, which displayed similar SH extinction levels to those obtained after the 2020 Australian fires. Gray regions indicate missing values (Materials and Methods). SAGE III/ISS and OSIRIS data shown here are the average of sunrise and sunset occultations.
Fig. 2.
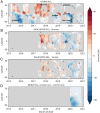
Monthly averaged 18.5-km level anomalies (percent) in deseasonalized available years of OSIRIS NOx (A) and sunrise (B) and sunset (C) SAGE III/ISS data along with the difference between the smoke and no-smoke model runs for 2020 (D). Gray regions in the data indicate missing values (Materials and Methods). The hatched regions on the OSIRIS panel show where the 2020 anomaly is greater than the maximum or less than the minimum anomaly over all the data from 2002 to 2019.
Fig. 3.
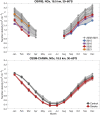
NOx concentrations (molecules/centimeter3) by month, averaged from 30 to 60°S at 18.5 km. The Top panel presents 20 y of OSIRIS measurements, with 2015 and 2016 (after the Calbuco eruption) and 2020 and 2021 (after the Australian black summer fires) distinguished from others by the indicated colors. The Bottom panel shows 20 realizations of 2020 both with (red) and without (gray) smoke for the same latitudes and altitude as calculated in the model.
Fig. 4.
Monthly mean deseasonalized NOx versus aerosol extinction at 18.5 km and from 45°S to 40°S for the model (A), OSIRIS (B), and SAGE III/ISS (C and D). The years 2015 and 2016 (after the Calbuco eruption) and 2020 and 2021 (after the Australian black summer fires) are in colors, while the other years make up the gray points. Outliers greater than four median absolute deviations from the median were removed from the OSIRIS NOx and SAGE III/ISS NOx data. Model points are averaged results for each month from each of the 20 ensemble members.
Fig. 5.
Calculated weekly averaged changes in total column ozone for the ensemble mean of the smoke minus no-smoke runs in the model (Top). These model runs did not allow smoke particles to pick up HNO3 and form PSCs. Observed anomalies in 2020 total column ozone from OMI observations (Bottom). The OMI data represent anomalies calculated after the time series has been linearly detrended over the period from 2005 to 2020 (Materials and Methods). Large negative anomalies during 2020 are indicated by line-hatching if they are lower than the 25th percentile.
Similar articles
- Viscosity and Phase State of Wildfire Smoke Particles in the Stratosphere from Pyrocumulonimbus Events: An Initial Assessment.
Zeng MF, Zuend A, Gerrebos NGA, Yu P, Schill GP, Murphy DM, Bertram AK. Zeng MF, et al. Environ Sci Technol. 2025 Apr 29;59(16):8037-8047. doi: 10.1021/acs.est.4c10597. Epub 2025 Apr 17. Environ Sci Technol. 2025. PMID: 40244658 - Wildfire smoke destroys stratospheric ozone.
Bernath P, Boone C, Crouse J. Bernath P, et al. Science. 2022 Mar 18;375(6586):1292-1295. doi: 10.1126/science.abm5611. Epub 2022 Mar 17. Science. 2022. PMID: 35298277 - Chlorine activation and enhanced ozone depletion induced by wildfire aerosol.
Solomon S, Stone K, Yu P, Murphy DM, Kinnison D, Ravishankara AR, Wang P. Solomon S, et al. Nature. 2023 Mar;615(7951):259-264. doi: 10.1038/s41586-022-05683-0. Epub 2023 Mar 8. Nature. 2023. PMID: 36890371 - Stratospheric ozone, global warming, and the principle of unintended consequences--an ongoing science and policy success story.
Andersen SO, Halberstadt ML, Borgford-Parnell N. Andersen SO, et al. J Air Waste Manag Assoc. 2013 Jun;63(6):607-47. doi: 10.1080/10962247.2013.791349. J Air Waste Manag Assoc. 2013. PMID: 23858990 Review. - Long-term impacts of non-occupational wildfire exposure on human health: A systematic review.
Gao Y, Huang W, Yu P, Xu R, Yang Z, Gasevic D, Ye T, Guo Y, Li S. Gao Y, et al. Environ Pollut. 2023 Mar 1;320:121041. doi: 10.1016/j.envpol.2023.121041. Epub 2023 Jan 10. Environ Pollut. 2023. PMID: 36639044
Cited by
- Envisioning a sustainable future for space launches: a review of current research and policy.
Brown TFM, Bannister MT, Revell LE. Brown TFM, et al. J R Soc N Z. 2023 Feb 2;54(3):273-289. doi: 10.1080/03036758.2022.2152467. eCollection 2024. J R Soc N Z. 2023. PMID: 39439876 Free PMC article. Review. - Significant chlorine emissions from biomass burning affect the long-term atmospheric chemistry in Asia.
Chang D, Li Q, Wang Z, Dai J, Fu X, Guo J, Zhu L, Pu D, Cuevas CA, Fernandez RP, Wang W, Ge M, Fung JCH, Lau AKH, Granier C, Brasseur G, Pozzer A, Saiz-Lopez A, Song Y, Wang T. Chang D, et al. Natl Sci Rev. 2024 Aug 16;11(9):nwae285. doi: 10.1093/nsr/nwae285. eCollection 2024 Sep. Natl Sci Rev. 2024. PMID: 39309413 Free PMC article. - Smoke-charged vortex doubles hemispheric aerosol in the middle stratosphere and buffers ozone depletion.
Ma C, Su H, Lelieveld J, Randel W, Yu P, Andreae MO, Cheng Y. Ma C, et al. Sci Adv. 2024 Jul 12;10(28):eadn3657. doi: 10.1126/sciadv.adn3657. Epub 2024 Jul 12. Sci Adv. 2024. PMID: 38996024 Free PMC article. - Viscosity and Phase State of Wildfire Smoke Particles in the Stratosphere from Pyrocumulonimbus Events: An Initial Assessment.
Zeng MF, Zuend A, Gerrebos NGA, Yu P, Schill GP, Murphy DM, Bertram AK. Zeng MF, et al. Environ Sci Technol. 2025 Apr 29;59(16):8037-8047. doi: 10.1021/acs.est.4c10597. Epub 2025 Apr 17. Environ Sci Technol. 2025. PMID: 40244658 - Uncovering the dominant contribution of intermediate volatility compounds in secondary organic aerosol formation from biomass-burning emissions.
Li K, Zhang J, Bell DM, Wang T, Lamkaddam H, Cui T, Qi L, Surdu M, Wang D, Du L, El Haddad I, Slowik JG, Prevot ASH. Li K, et al. Natl Sci Rev. 2024 Jan 9;11(3):nwae014. doi: 10.1093/nsr/nwae014. eCollection 2024 Mar. Natl Sci Rev. 2024. PMID: 38390366 Free PMC article.
References
- Torres O., et al. , Stratospheric injection of massive smoke plume from Canadian boreal fires in 2017 as seen by DSCOVR-EPIC, CALIOP, and OMPS-LP observations. J. Geophys Res. Atmos. 125, e2020JD032579 (2020).
- Khaykin S., et al. , The 2019/20 Australian wildfires generated a persistent smoke-charged vortex rising up to 35 km altitude. Commun. Earth Environ. 1, 22 (2020).
- Peterson D. A., et al. , Australia’s Black Summer pyrocumulonimbus super outbreak reveals potential for increasingly extreme stratospheric smoke events. npj Clim. Atmo. Sci. 4, 38 (2021).
- Seneviratne S., et al. , “Weather and climate extreme events in a changing climate” (IPCC sixth assessment report, WMO/UNEP, 2021), chap. 11.
- Baars H., et al. , The unprecedented 2017-2018 stratospheric smoke event: Decay phase and aerosol properties observed with the EARLINET. Atmos. Chem. Phys. 19, 15183–15198 (2019).
MeSH terms
Substances
LinkOut - more resources
Full Text Sources
Medical


