Spatial distribution of live gut microbiota and bile acid metabolism in various parts of human large intestine - PubMed (original) (raw)
doi: 10.1038/s41598-022-07594-6.
Toshihiko Takada 3, Tatsuya Mikami 4, Kensuke Shimizu 3, Kosuke Oana 3, Tetsu Arai 5, Kazuki Akitaya 5, Hirotake Sakuraba 5, Miyuki Katto 3, Yusuke Nagara 3, Hiroshi Makino 6, Daichi Fujii 7, Kenji Oishi 3, Shinsaku Fukuda 5
Affiliations
- PMID: 35246580
- PMCID: PMC8897406
- DOI: 10.1038/s41598-022-07594-6
Spatial distribution of live gut microbiota and bile acid metabolism in various parts of human large intestine
Daisuke Chinda et al. Sci Rep. 2022.
Abstract
Gut microbiomics is based on analysis of both live and dead cells in the stool. However, to understand the ecology of gut microbiota and their symbiotic relationships with hosts, spatial distribution of live bacteria must be examined. Here, we analyzed the live composition of luminal microbiota (LM) and mucosa-associated microbiota (MAM) in the ascending and descending colons and the rectums of 10 healthy adults and compared it with the total composition. The abundance of Lachnospiraceae in live LM decreased along the gut length and was significantly lower than that in total LM. Contrastingly, the abundance of Bacteroidaceae and Bifidobacteriaceae in live LM was higher than that in total LM, suggesting differences in death rate during gut migration. Live Enterobacteriaceae levels in MAM were significantly higher in rectum than in the ascending and descending colons and in LM. High-performance liquid chromatographic analysis of luminal bile acids revealed that 7α-dehydroxylation occurred towards the rectum. In live LM where a bile acid-inducible gene could be detected, 7α-dehydroxylation rates were higher than those in the group without the gene. Overall, we showed differences in live bacteria composition among three gut sites and between LM and MAM, highlighting the importance of understanding their spatial distribution.
© 2022. The Author(s).
Conflict of interest statement
The authors declare no competing interests.
Figures
Figure 1
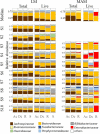
Relative abundance of total and live bacterial families within the luminal microbiota (LM) and mucosa-associated microbiota (MAM) from each part of the gut. Bacterial family distribution of the operational taxonomic units (OTUs). The relative abundance of total bacteria and live bacteria within LM from 10 subjects were analyzed. The relative abundance of total bacteria and live bacteria within MAM from only 8 subjects are shown; due to the small amount of DNA obtained from mucosal scraping samples of subjects 1 and 2, their respective results were not included. Eight major contributing families are displayed in different colors and other minor contributing families are grouped and displayed in white. LM: luminal microbiota; MAM: mucosa-associated microbiota; OTU: operational taxonomic unit; Ac: ascending colon; Dc: descending colon; R: rectum; S: stool.
Figure 2
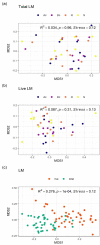
NMDS ordinations and PERMANOVA analyses of LM composition. (a) Overall comparison of total LM composition among three gut sites and stool, (b) overall comparison of live LM composition among three gut sites and stool, (c) overall comparison between total and live LM composition. All ordinations and PERMANOVA analyses were performed using Bray–Curtis distance matrix based on relative abundance of taxa at the family level. LM: luminal microbiota; NMDS: Non-metric multidimensional scaling; Ac: ascending colon; Dc: descending colon; R: rectum; S: stool.
Figure 3
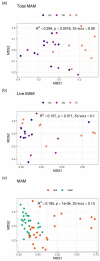
NMDS ordinations and PERMANOVA analyses of MAM composition. (a) Overall comparison of total MAM composition among three gut sites, (b) overall comparison of live MAM composition among three gut sites, (c) overall comparison between total and live MAM composition. All ordinations and PERMANOVA analyses were performed using Bray–Curtis distance matrix based on relative abundance of taxa at the family level. NMDS: Non-metric multidimensional scaling; MAM: mucosa-associated microbiota; Ac: ascending colon; Dc: descending colon; R: rectum.
Figure 4
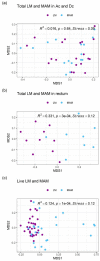
NMDS ordinations and PERMANOVA analyses of LM and MAM composition. (a) Overall comparison between total LM and MAM composition in both ascending and descending colons, (b) overall comparison between total LM and MAM composition in the rectum, (c) overall comparison between live LM and MAM composition in three gut sites. All ordinations and PERMANOVA analyses were performed using Bray–Curtis distance matrix based on relative abundance of taxa at the family level. NMDS: Non-metric multidimensional scaling; MAM: mucosa-associated microbiota; LM: luminal microbiota.
Figure 5
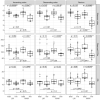
Comparison of the α-diversity of total and live bacteria in LM and MAM from each part of the gut. Top row: results of Shannon index; center: observed OTUs; and bottom: PD for the ascending colon, descending colon, and rectum as labeled. Statistical analysis was performed using the Wilcoxon's rank-sum test: *P < 0.05, **P < 0.01. LM: luminal microbiota; MAM: mucosa-associated microbiota; OTU: operational taxonomic unit; MAM: mucosa-associated microbiota; LM: luminal microbiota; total: total bacteria; live: live bacteria.
Figure 6
The deconjugation rate of bile acids in stool and contents from each part of the gut. The ratio (%) of deconjugated bile acids to the total bile acids’ concentration is represented. Ac: ascending colon; Dc: descending colon; R: rectum; S: stool.
Figure 7
The 7α-dehydroxylation rate of bile acids in stool and contents from each part of the gut. The ratio (%) of 7α-dehydroxylated bile acids to the total bile acid concentration is represented. Ac: ascending colon; Dc: descending colon; R: rectum; S: stool.
Figure 8
Relationship between 7α-dehydroxylation rate and the abundance of the presumed _bai_-exhibiting features in total and live bacteria. The box plots of 7α-dehydroxylation rates were used to investigate the relationship between 7α-dehydroxylation rate and the presence or absence of presumed _bai_-exhibiting features in total and live bacteria. Statistical analysis was performed using the Wilcoxon's rank-sum test: *P < 0.05.
Similar articles
- Preservation of conjugated primary bile acids by oxygenation of the small intestinal microbiota in vitro.
Firrman J, Friedman ES, Hecht A, Strange WC, Narrowe AB, Mahalak K, Wu GD, Liu L. Firrman J, et al. mBio. 2024 Jun 12;15(6):e0094324. doi: 10.1128/mbio.00943-24. Epub 2024 May 10. mBio. 2024. PMID: 38727244 Free PMC article. - High throughput sequencing reveals distinct microbial populations within the mucosal and luminal niches in healthy individuals.
Ringel Y, Maharshak N, Ringel-Kulka T, Wolber EA, Sartor RB, Carroll IM. Ringel Y, et al. Gut Microbes. 2015;6(3):173-81. doi: 10.1080/19490976.2015.1044711. Gut Microbes. 2015. PMID: 25915459 Free PMC article. - Functional Intestinal Bile Acid 7α-Dehydroxylation by Clostridium scindens Associated with Protection from Clostridium difficile Infection in a Gnotobiotic Mouse Model.
Studer N, Desharnais L, Beutler M, Brugiroux S, Terrazos MA, Menin L, Schürch CM, McCoy KD, Kuehne SA, Minton NP, Stecher B, Bernier-Latmani R, Hapfelmeier S. Studer N, et al. Front Cell Infect Microbiol. 2016 Dec 20;6:191. doi: 10.3389/fcimb.2016.00191. eCollection 2016. Front Cell Infect Microbiol. 2016. PMID: 28066726 Free PMC article. - The Role of the Gut Microbiota in Bile Acid Metabolism.
Ramírez-Pérez O, Cruz-Ramón V, Chinchilla-López P, Méndez-Sánchez N. Ramírez-Pérez O, et al. Ann Hepatol. 2017 Nov;16(Suppl. 1: s3-105.):s15-s20. doi: 10.5604/01.3001.0010.5494. Ann Hepatol. 2017. PMID: 29080339 Review. - Consequences of bile salt biotransformations by intestinal bacteria.
Ridlon JM, Harris SC, Bhowmik S, Kang DJ, Hylemon PB. Ridlon JM, et al. Gut Microbes. 2016;7(1):22-39. doi: 10.1080/19490976.2015.1127483. Gut Microbes. 2016. PMID: 26939849 Free PMC article. Review.
Cited by
- Cholelithiasis, Gut Microbiota and Bile Acids after Bariatric Surgery-Can Cholelithiasis Be Prevented by Modulating the Microbiota? A Literature Review.
Komorniak N, Pawlus J, Gaweł K, Hawryłkowicz V, Stachowska E. Komorniak N, et al. Nutrients. 2024 Aug 3;16(15):2551. doi: 10.3390/nu16152551. Nutrients. 2024. PMID: 39125429 Free PMC article. Review. - Association of probiotic use with nivolumab effectiveness against various cancers: A multicenter retrospective cohort study.
Arai J, Niikura R, Hayakawa Y, Suzuki N, Honda T, Okamura T, Hasatani K, Yoshida N, Nishida T, Sumiyoshi T, Kiyotoki S, Ikeya T, Arai M, Boku N, Fujishiro M. Arai J, et al. Cancer Med. 2023 Aug;12(16):16876-16880. doi: 10.1002/cam4.6313. Epub 2023 Jul 8. Cancer Med. 2023. PMID: 37421306 Free PMC article. - Bile acids, gut microbiota, and therapeutic insights in hepatocellular carcinoma.
Song Y, Lau HC, Zhang X, Yu J. Song Y, et al. Cancer Biol Med. 2023 Dec 23;21(2):144-62. doi: 10.20892/j.issn.2095-3941.2023.0394. Cancer Biol Med. 2023. PMID: 38148326 Free PMC article. Review. - Probiotics Mechanism of Action on Immune Cells and Beneficial Effects on Human Health.
Mazziotta C, Tognon M, Martini F, Torreggiani E, Rotondo JC. Mazziotta C, et al. Cells. 2023 Jan 2;12(1):184. doi: 10.3390/cells12010184. Cells. 2023. PMID: 36611977 Free PMC article. Review. - The role of intestinal flora on tumorigenesis, progression, and the efficacy of PD-1/PD-L1 antibodies in colorectal cancer.
Wang S, Xu B, Zhang Y, Chen G, Zhao P, Gao Q, Yuan L. Wang S, et al. Cancer Biol Med. 2023 Dec 23;21(1):65-82. doi: 10.20892/j.issn.2095-3941.2023.0376. Cancer Biol Med. 2023. PMID: 38148328 Free PMC article. Review.
References
- Gibson GR, Roberfroid MB. Dietary modulation of the human colonic microbiota: Introducing the concept of prebiotics. J. Nutr. 1995;125:1401–1412. - PubMed
- Standring, S. Gray’s Anatomy-The Anatomical Basis Of Clinical Practice. 40th ed. (Churchill Livingstone, 2008).
MeSH terms
Substances
LinkOut - more resources
Full Text Sources
