Improved prediction of protein-protein interactions using AlphaFold2 - PubMed (original) (raw)
Improved prediction of protein-protein interactions using AlphaFold2
Patrick Bryant et al. Nat Commun. 2022.
Erratum in
- Author Correction: Improved prediction of protein-protein interactions using AlphaFold2.
Bryant P, Pozzati G, Elofsson A. Bryant P, et al. Nat Commun. 2022 Mar 24;13(1):1694. doi: 10.1038/s41467-022-29480-5. Nat Commun. 2022. PMID: 35332153 Free PMC article. No abstract available.
Abstract
Predicting the structure of interacting protein chains is a fundamental step towards understanding protein function. Unfortunately, no computational method can produce accurate structures of protein complexes. AlphaFold2, has shown unprecedented levels of accuracy in modelling single chain protein structures. Here, we apply AlphaFold2 for the prediction of heterodimeric protein complexes. We find that the AlphaFold2 protocol together with optimised multiple sequence alignments, generate models with acceptable quality (DockQ ≥ 0.23) for 63% of the dimers. From the predicted interfaces we create a simple function to predict the DockQ score which distinguishes acceptable from incorrect models as well as interacting from non-interacting proteins with state-of-art accuracy. We find that, using the predicted DockQ scores, we can identify 51% of all interacting pairs at 1% FPR.
© 2022. The Author(s).
Conflict of interest statement
The authors declare no competing interests.
Figures
Fig. 1. DockQ scores for the test set (n = 1481 for all but RF, n = 1455).
Distribution of DockQ scores as boxplots for different modelling strategies on the test set. Boxes encompass data quartiles, horizontal lines mark the medians and upper and lower whiskers indicate respectively maximum and minimum values for each distribution. All AF2 models have been run with the same neural network configuration (m1-10-1). Outlier points are not displayed here. AF2, refers to running AF2 using the default AF2 MSAs, “Paired” refers to using MSAs paired using information about species and “Block” refers to using block diagonalization MSAs.
Fig. 2. Model quality metrics and multiple model ranking.
a ROC curve as a function of different metrics for the test dataset (n = 1481, first run). Cβs within 8 Å from each other from different chains are used to define the interface. IF_plDDT is the average plDDT of interface residues, min plDDT per chain is the minimum average plDDT of both chains, average plDDT is the average of the entire complex and IF_contacts and IF_residues are the number of interface residues and contacts respectively. pDockQ is a sigmoidal fit to the combined metric IF_plDDT⋅log(IF_contacts) fitted to predict DockQ as the target score, see C. b Average interface plDDT vs the logarithm of the interface contacts coloured by DockQ score on the test set (n = 1481). Increasing both the number of interface contacts and average interface plDDT results in higher DockQ scores. c Using the combined metric IF_plDDT⋅log(IF_contacts), we fit a sigmoidal curve towards the DockQ scores on the test set (n = 1481), enabling predicting the DockQ score in a continuous manner (pDockQ). The average error overall is 0.14 DockQ score. d Impact of different initialisations on the modelling outcome in terms of DockQ score on the test dataset (n = 1481). The maximal and minimal scores are plotted against the top-ranked models using the pDockQ scores for the AF2 + paired MSAs, m1-10-1.
Fig. 3. DockQ distributions for test dataset (n = 1481) tertiles.
a Distribution of DockQ scores for three sets of interfaces with the majority of Helix, Sheet and Coil secondary structures. b Distribution of DockQ scores for tertiles derived from the distribution of contact counts in docking model interfaces. c Distribution of DockQ scores for tertiles derived from the distribution of Paired MSAs Neff scores. d Distribution of DockQ scores for the top three organisms H. sapiens, S. cerevisiae and E. coli.
Fig. 4. Predicted and native structures from the set of novel proteins without templates.
The native structures are represented as grey ribbons. a Docking of
7EIV
chains A (blue) and C (green) (DockQ = 0.76). b Docking of
7MEZ
chains A (blue) and B (green) (DockQ = 0.53). c Prediction of structure
7EL1
chains A (blue) and E (green) (DockQ = 0.01). The DNA going through chain A is coloured in orange. d Docking of
7LF7
chains A (blue) and M (magenta) (DockQ = 0.02) and chains B (green) and M (magenta) (DockQ = 0.02).
Fig. 5. Discrimination of interacting (n = 1481) and non-interacting (n = 5694) proteins.
a The ROC curve as a function of different metrics for discriminating between interacting and non-interacting proteins. IF_plDDT is the average plDDT in the interface, min plDDT per chain is the minimum average plDDT of both chains, average plDDT is the average of the entire complex and IF_contacts and IF_residues are the number of interface residues and contacts respectively. pDockQ is a sigmoidal fit to this with DockQ as the target score, as described above. b–d Distribution of the top discriminating features average interface plDDT (b), the number of interface contacts (c), and d the combination of these (IF_plDDT⋅log(IF_contacts)) and the pDockQ for interacting (non-grey) and non-interacting proteins (grey).
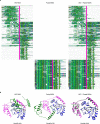
Fig. 6. Comparison of different MSAs.
a Depiction of MSAs generated by AF2 and the paired version matched using organism information. Both AF and paired representations are sections containing 10% of the sequences aligned in the original MSA. Concatenated chains are separated by a vertical line (magenta). The visualisations were made using Jalview version 2.11.1.4. b Docking visualisations for PDB ID
5D1M
with the model/native chains A in blue/grey and B in green/magenta using the three different MSAs in (a). The DockQ scores are 0.01, 0.02 and 0.90 for AF2, paired, and AF2 + paired MSAs, respectively.
Similar articles
- DockQ: A Quality Measure for Protein-Protein Docking Models.
Basu S, Wallner B. Basu S, et al. PLoS One. 2016 Aug 25;11(8):e0161879. doi: 10.1371/journal.pone.0161879. eCollection 2016. PLoS One. 2016. PMID: 27560519 Free PMC article. - Predicting residue-specific qualities of individual protein models using residual neural networks and graph neural networks.
Zhao C, Liu T, Wang Z. Zhao C, et al. Proteins. 2022 Dec;90(12):2091-2102. doi: 10.1002/prot.26400. Epub 2022 Jul 30. Proteins. 2022. PMID: 35842895 Free PMC article. - DockQ v2: improved automatic quality measure for protein multimers, nucleic acids, and small molecules.
Mirabello C, Wallner B. Mirabello C, et al. Bioinformatics. 2024 Oct 1;40(10):btae586. doi: 10.1093/bioinformatics/btae586. Bioinformatics. 2024. PMID: 39348158 Free PMC article. - AI-Based Protein Structure Prediction in Drug Discovery: Impacts and Challenges.
Schauperl M, Denny RA. Schauperl M, et al. J Chem Inf Model. 2022 Jul 11;62(13):3142-3156. doi: 10.1021/acs.jcim.2c00026. Epub 2022 Jun 21. J Chem Inf Model. 2022. PMID: 35727311 Review. - Integrating Large-Scale Protein Structure Prediction into Human Genetics Research.
Correa Marrero M, Jänes J, Baptista D, Beltrao P. Correa Marrero M, et al. Annu Rev Genomics Hum Genet. 2024 Aug;25(1):123-140. doi: 10.1146/annurev-genom-120622-020615. Epub 2024 Aug 6. Annu Rev Genomics Hum Genet. 2024. PMID: 38621234 Review.
Cited by
- Leveraging coevolutionary insights and AI-based structural modeling to unravel receptor-peptide ligand-binding mechanisms.
Snoeck S, Lee HK, Schmid MW, Bender KW, Neeracher MJ, Fernández-Fernández AD, Santiago J, Zipfel C. Snoeck S, et al. Proc Natl Acad Sci U S A. 2024 Aug 13;121(33):e2400862121. doi: 10.1073/pnas.2400862121. Epub 2024 Aug 6. Proc Natl Acad Sci U S A. 2024. PMID: 39106311 Free PMC article. - A Common Polymorphism in RNASE6 Impacts Its Antimicrobial Activity toward Uropathogenic Escherichia coli.
Anguita R, Prats-Ejarque G, Moussaoui M, Becknell B, Boix E. Anguita R, et al. Int J Mol Sci. 2024 Jan 3;25(1):604. doi: 10.3390/ijms25010604. Int J Mol Sci. 2024. PMID: 38203775 Free PMC article. - Impact of Asp/Glu-ADP-ribosylation on protein-protein interaction and protein function.
Pei J, Zhang J, Wang XD, Kim C, Yu Y, Cong Q. Pei J, et al. Proteomics. 2023 Sep;23(17):e2200083. doi: 10.1002/pmic.202200083. Epub 2022 Dec 11. Proteomics. 2023. PMID: 36453556 Free PMC article. - GTE: a graph learning framework for prediction of T-cell receptors and epitopes binding specificity.
Jiang F, Guo Y, Ma H, Na S, Zhong W, Han Y, Wang T, Huang J. Jiang F, et al. Brief Bioinform. 2024 May 23;25(4):bbae343. doi: 10.1093/bib/bbae343. Brief Bioinform. 2024. PMID: 39007599 Free PMC article. - Anti-symmetric framework for balanced learning of protein-protein interactions.
Tang T, Li T, Li W, Cao X, Liu Y, Zeng X. Tang T, et al. Bioinformatics. 2024 Oct 1;40(10):btae603. doi: 10.1093/bioinformatics/btae603. Bioinformatics. 2024. PMID: 39404784 Free PMC article.
References
- Liddington, R. C. Structural Basis of Protein–Protein Interactions. Protein-Protein Interactions261, 3–14 10.1385/1-59259-762-9:003 (2004). - PubMed
- Keskin O, Gursoy A, Ma B, Nussinov R. Principles of protein-protein interactions: what are the preferred ways for proteins to interact? Chem. Rev. 2008;108:1225–1244. - PubMed
Publication types
MeSH terms
Substances
LinkOut - more resources
Full Text Sources
Other Literature Sources


