Hmx gene conservation identifies the origin of vertebrate cranial ganglia - PubMed (original) (raw)
Hmx gene conservation identifies the origin of vertebrate cranial ganglia
Vasileios Papadogiannis et al. Nature. 2022 May.
Abstract
The evolutionary origin of vertebrates included innovations in sensory processing associated with the acquisition of a predatory lifestyle1. Vertebrates perceive external stimuli through sensory systems serviced by cranial sensory ganglia, whose neurons arise predominantly from cranial placodes; however, the understanding of the evolutionary origin of placodes and cranial sensory ganglia is hampered by the anatomical differences between living lineages and the difficulty in assigning homology between cell types and structures. Here we show that the homeobox transcription factor Hmx is a constitutive component of vertebrate sensory ganglion development and that in the tunicate Ciona intestinalis, Hmx is necessary and sufficient to drive the differentiation programme of bipolar tail neurons, cells previously thought to be homologues of neural crest2,3. Using Ciona and lamprey transgenesis, we demonstrate that a unique, tandemly duplicated enhancer pair regulated Hmx expression in the stem-vertebrate lineage. We also show notably robust vertebrate Hmx enhancer function in Ciona, demonstrating that deep conservation of the upstream regulatory network spans the evolutionary origin of vertebrates. These experiments demonstrate regulatory and functional conservation between Ciona and vertebrate Hmx, and point to bipolar tail neurons as homologues of cranial sensory ganglia.
© 2022. The Author(s), under exclusive licence to Springer Nature Limited.
Conflict of interest statement
Competing interests
We have no competing interests to declare.
Figures
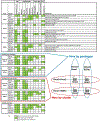
Extended Data Fig. 1. Expression of jawed vertebrate Hmx genes in neural derivatives.
The summaries show expression by gene cluster, by genome duplication paralogue (as in the associated diagram), or overall.
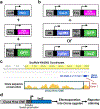
Extended Data Fig. 2. Schematics of experimental strategies for reporter assays and Ciona Hmx CNE identification.
a. Hmx overexpression in Ciona. b. Hmx or Ngn CRISPR Cas9 knockout in Ciona. c. Ciona Hmx CNE identification. Approximately 2Kbp 5’ to the first Hmx exon in Ciona intestinalis (Type A) (Ciona robusta) scaffold KhS563 is shown, with conservation to the Hmx locus in C_iona savignyi_ shown below. d. Ciona Hmx CNE analysis in Ciona.
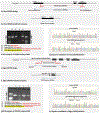
Extended Data Fig. 3. CRISPR-Cas9 knockout of Ciona Hmx and Ciona Ngn.
a. Placement of sgRNA guides for Hmx CRISPR knockout and primers used for validation, relative to gene structure. Guide and primer sequences in Methods and Supplementary Table 1. b. Predicted engineered outcome of Hmx CRISPR knockout. c. PCR amplification of Ciona intestinalis (Type B) genomic DNA from wild type, CRISPR control and Hmx CRISPR embryo DNA (as well as from additional sgRNAs that were tested but not used in further experiments). The guide used in further experiments is marked in yellow. Sizes of bands in the DNA ladder (100bp DNA-Ladder, extended: Carl Roth) are given in base pairs (bp). d. Sequencing of amplified bands with sequence identity matching the predicted outcomes in (b). e. Placement of sgRNA guides for Ngn CRISPR knockout and primers used for validation, relative to gene structure. Guide and primer sequences in Methods and Supplementary Table 1. f. Predicted engineered outcome of Ngn CRISPR knockout. g. PCR amplification of Ciona intestinalis (Type B) genomic DNA from wild type, CRISPR control and Ngn CRISPR embryo DNA (as well as from additional sgRNAs that were tested but not used in further experiments). The guide used in further experiments is marked in yellow. Sizes of bands in the DNA ladder (100bp DNA-Ladder, extended: Carl Roth) are given in base pairs (bp). h. Sequencing of amplified bands with sequence identity matching the predicted outcomes in (f).
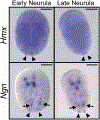
Extended Data Fig. 4. Early developmental expression of Hmx and Ngn in C. intestinalis (Type B).
Gene expression was analysed by whole mount in situ hybridisation. Only posterior BTNs (arrowheads) are marked by faint Hmx expression during neurula stages, while Ngn is expressed in posterior BTNs (arrowheads) and anterior BTNs (arrows) and the CNS. Scale bars 100μM.
Extended Data Fig. 5. Molecular phylogenetic analysis of chordate Hmx sequences and alignment of lamprey Hmx sequences.
a. This phylogenetic analysis includes Hmx sequences from amphioxus and Ciona. The analysis was conducted using the Maximum Likelihood method and numbers indicate percentage node support out of 1000 bootstraps. b. Lamprey HmxA, HmxB and HmxC nucleotide sequence alignment. The translation shows the identical homeodomain amino-acid sequence encoded by all three genes. HmxA and HmxC share additional nucleotide sequence identity before and after the homeodomain encoding sequence. Nucleotide sequences are from the lamprey Lethenteron camtschaticum.
Extended Data Fig. 6.. Model of evolution of vertebrate Hmx uCNE and dCNE from an ancestral udCNE.
CNE activity is shown in green on the embryo diagrams in the Central Nervous System (CNS) and Cranial Sensory Ganglia (CSG).
Extended Data Fig. 7. Assessment of background deriving from the vector used to generate lamprey transgenics.
Embryos were injected with vector only (which includes the zebrafish krt4 minimal promoter and reporter gene but no cloned enhancer), allowed to develop then fixed and labelled for DNA (DAPI, blue), GFP (green) and Hu/ELAV (red) before analysis by confocal microscopy. Each embryo was scored for expression in multiple tissues, as shown in the table at the top right of the picture, with a focus on tissues overlapping with Hmx expression. D and A indicate dorsal and anterior orientations for each image. CSG, cranial sensory ganglia. G, geniculate ganglion. VA, vestibuloacoustic ganglion. P, petrosal ganglion. Spinal cord expression was confined to isolated cells and distinct from the consistent column of expression generated by Hmx enhancers (see Figure 4, main text). Brain expression appeared in the dorsal hindbrain and midbrain and was also distinct from Hmx and Hmx enhancer expression. In two embryos (1 and 2 below: also in high magnification in top left focused on the otic area) close examination revealed scattered cells around some cranial ganglia, including a few co-expressing Hu/ELAV. These differed from those labelled with Hmx enhancers in that GFP staining did not penetrate into axons. Scale bars 100μM except for the high magnification views of the otic region where they are 10μM.
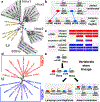
Figure 1.. Hmx expression in chordates.
a. Phylogeny of the chordates showing the evolutionary ancestry of key characters. b. Schematic depiction of Hmx expression in jawed vertebrate cranial placodes/ganglia. Species shown are: Mm, Mus musculus. Gg, Gallus gallus. Xt-Xenopus tropicalis. Dr, Danio rerio. Ol, Oryzias latipes. Where species are missing it means either the gene has not been analysed (Hmx2 in Gg and Xt) or the gene has been lost (SOHo in Mm). Other abbreviations: Ep, epibranchial. LL, lateral line. Ot/Va, otic/vestibuloacoustic. Tri, trigeminal. CNS, central nervous system. X indicates lateral line ganglia have been lost by these species. The olfactory is not shown as Hmx expression has not been reported from this placode. Full analysis underlying this figure in Extended Data Fig. 1. c-h. Expression of lamprey Hmx genes. c. HmxB expression starts in cranial sensory ganglia at stage 23. d. Hypothalamus expression in also seen by stage 24. An expression domain below the branchial basket corresponds to the position of the hypobranchial ganglia. e, f. Hindbrain and spinal cord express HmxB at stages 25 and 26: branchial arch stain in (f) is an artefact of antibody trapping. g, h. Expression of lamprey HmxA and HmxC is identical to HmxB. Abbreviations: N, nodose. P, petrosal. G, geniculate. O, otic. Tg, trigeminal. SC, spinal cord. Hp, hypobranchial. Hy, hypothalamus. i, j. Hmx expression in amphioxus (i) compared to the neural marker Hu/ELAV (j). Arrows mark some of the peripheral neurons expressing Hu/ELAV. Hmx expression is confined to the CNS. k-m. Hmx expression In Ciona. Black arrows identify BTNs, white arrows expression in the CNS. The inset on (m) shows a dorsal view with BTNs lying parallel to the CNS. All scale bars 100μM. Lamprey images representative of at least 5 embryos for each stage, amphioxus and Ciona images representative of at least 10 embryos.
Figure 2.. Hmx regulation and downstream target genes in Ciona.
a. Above is a schematic of the strategy used to drive Ciona Hmx overexpression. Below the volcano plot shows genes up or down regulated after Ciona Hmx overexpression. Selected genes are named. Colour coding reflects genes identified as cell type expressed in single cell sequencing data, according to the code shown. Data analysed using negative binomial generalized linear models the DESeq2, P values adjusted (p adj) for multiple testing. Table 1 shows precise numbers, underlying data in Supplementary File 1.b. Expression of Ngn>GFP and Asic>GFP constructs in control embryos (white arrowheads) and in cells ectopically expressing Hmx driven by epiB>Hmx (red arrowheads). c. Overlap of upregulated Hmx target genes and genes differentially expressed after Ngn overexpression and knockdown. Subset of genes upregulated by Hmx overexpression that were also upregulated by Ngn overexpression or downregulated by Ngn knockdown and BTN expressed genes from single cell data are shown. Full data in Supplementary File 2. d. BTN marker activity after Hmx CRISPR Cas9 knockout. Fog>H2B:mCherry marks successful uptake of the electroporation mix. BTN signal for both early (Ngn) and late (Asic) markers (closed arrowheads) was lost after Hmx knockout (open arrowheads). Numbers in Extended Data Table 1. e-g. Ciona Hmx CNE activity in Ciona embryos, visualised by lacZ staining. (e) shows a tailbud stage embryo with stain in BTNs, seen in close up in (e’). (f,g) show BTN and CNS staining respectively in early larvae. Numbers indicate number of embryos showing staining in the indicated structures, out of total surviving embryos. Full embryo counts in Extended Data Table 3. h. Ciona Hmx CNE activity in controls (closed arrowhead) and its loss after Ngn CRISPR Cas9 knockout (open arrowhead). Fog>H2B:mCherry marks successful uptake of the electroporation mix. Numbers in Extended Data Table 2. i. BTN specification network model. Scale bars 100μM except e-g (50μM).
Figure 3.. Vertebrate Hmx locus evolution and CNE identification
a. Phylogeny of vertebrate Hmx proteins. Tree constructed using the Maximum Likelihood method, values indicate percentage bootstrap support and scale indicates number of substitutions per site. b. Comparative mapping of jawed and jawless vertebrate Hmx loci identifies two CNEs. c. Sequence similarity between uCNE and dCNE sequences in lamprey, human and chicken show they derived from an ancestral pre-duplication CNE. Coloured boxes indicate regions of sequence similarity amongst uCNE sequences (red), dCNE sequences (blue) and between uCNE and dCNE sequences (dashed red and blue). Sequence alignments in Supplementary Files 3–5. d. uCNE and dCNE sequences form monophyletic groups in molecular phylogenetic analysis. Tree constructed using the Maximum Likelihood method, values indicate percentage bootstrap support and scale indicates number of substitutions per site. e. Model for the evolution of Hmx loci. The current arrangements in vertebrates evolved from a single ancestral cluster with both uCNE and dCNE elements present, which itself evolved from a one-gene state with a single ancestral udCNE.
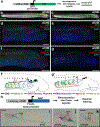
Figure 4.. Lamprey Hmx CNE activity in transgenic lamprey and Ciona embryos
a. Experimental strategy for detecting reporter activity in lamprey embryos. b, c. Representative embryos showing dCNE>GFP and uCNE>GFP activity in the CNS. Numbers show the number of times CNS expression was seen out of the number of embryos screened. Analysis of vector-only controls is shown in Extended Data Fig. 7. d, e. Confocal reconstructions of lamprey embryos transgenic for dCNE>GFP, showing activity (green) in forebrain, midbrain, hindbrain and spinal cord. f, g. Confocal reconstructions of lamprey embryos transgenic for uCNE>GFP, showing activity in the CNS, and in peripheral nerves. In (d-g) ganglia and other neurons are stained red using an antibody to Hu/ELAV. f’, g’ Schematic tracing of embryos shown in (f) and (g) respectively, with nerve CNE reporter activity traced and colour coded. h. Schematic of the experimental method used to examine lamprey CNE activity in Ciona. i-k. Transgenic Ciona larvae stained for lamprey dCNE reporter activity. Numbers indicate the number of times expression in the cells identified was seen, out of total surviving larvae. Full embryo counts in Extended Data Table 3. All scale bars 100μM.
Similar articles
- Shared evolutionary origin of vertebrate neural crest and cranial placodes.
Horie R, Hazbun A, Chen K, Cao C, Levine M, Horie T. Horie R, et al. Nature. 2018 Aug;560(7717):228-232. doi: 10.1038/s41586-018-0385-7. Epub 2018 Aug 1. Nature. 2018. PMID: 30069052 Free PMC article. - Molecular evidence from Ciona intestinalis for the evolutionary origin of vertebrate sensory placodes.
Mazet F, Hutt JA, Milloz J, Millard J, Graham A, Shimeld SM. Mazet F, et al. Dev Biol. 2005 Jun 15;282(2):494-508. doi: 10.1016/j.ydbio.2005.02.021. Dev Biol. 2005. PMID: 15950613 - Neural crest lineage in the protovertebrate model Ciona.
Todorov LG, Oonuma K, Kusakabe TG, Levine MS, Lemaire LA. Todorov LG, et al. Nature. 2024 Nov;635(8040):912-916. doi: 10.1038/s41586-024-08111-7. Epub 2024 Oct 23. Nature. 2024. PMID: 39443803 - The evolutionary history of vertebrate cranial placodes II. Evolution of ectodermal patterning.
Schlosser G, Patthey C, Shimeld SM. Schlosser G, et al. Dev Biol. 2014 May 1;389(1):98-119. doi: 10.1016/j.ydbio.2014.01.019. Epub 2014 Feb 1. Dev Biol. 2014. PMID: 24491817 Review. - Molecular evidence from ascidians for the evolutionary origin of vertebrate cranial sensory placodes.
Mazet F, Shimeld SM. Mazet F, et al. J Exp Zool B Mol Dev Evol. 2005 Jul 15;304(4):340-6. doi: 10.1002/jez.b.21054. J Exp Zool B Mol Dev Evol. 2005. PMID: 15981200 Review.
Cited by
- Specification of distinct cell types in a sensory-adhesive organ important for metamorphosis in tunicate larvae.
Johnson CJ, Razy-Krajka F, Zeng F, Piekarz KM, Biliya S, Rothbächer U, Stolfi A. Johnson CJ, et al. PLoS Biol. 2024 Mar 13;22(3):e3002555. doi: 10.1371/journal.pbio.3002555. eCollection 2024 Mar. PLoS Biol. 2024. PMID: 38478577 Free PMC article. - Multiple Forms of Neural Cell Death in the Cyclical Brain Degeneration of A Colonial Chordate.
Anselmi C, Caicci F, Bocci T, Guidetti M, Priori A, Giusti V, Levy T, Raveh T, Voskoboynik A, Weissman IL, Manni L. Anselmi C, et al. Cells. 2023 Mar 29;12(7):1041. doi: 10.3390/cells12071041. Cells. 2023. PMID: 37048113 Free PMC article. - Comparative analysis of Hmx expression and the distribution of neuronal somata in the trigeminal ganglion in lamprey and shark: insights into the homology of the trigeminal nerve branches and the evolutionary origin of the vertebrate jaw.
Tamura M, Ishikawa R, Nakanishi Y, Pascual-Anaya J, Fukui M, Saitou T, Sugahara F, Rijli FM, Kuratani S, Suzuki DG, Murakami Y. Tamura M, et al. Zoological Lett. 2023 Dec 5;9(1):23. doi: 10.1186/s40851-023-00222-9. Zoological Lett. 2023. PMID: 38049907 Free PMC article. - Quantitative proteome dynamics across embryogenesis in a model chordate.
Frese AN, Mariossi A, Levine MS, Wühr M. Frese AN, et al. iScience. 2024 Feb 29;27(4):109355. doi: 10.1016/j.isci.2024.109355. eCollection 2024 Apr 19. iScience. 2024. PMID: 38510129 Free PMC article. - Ascidian gene regulation and bioadhesion.
Rothbächer U. Rothbächer U. Genesis. 2023 Nov;61(6):e23572. doi: 10.1002/dvg.23572. Epub 2023 Nov 27. Genesis. 2023. PMID: 38009987 Free PMC article. No abstract available.
References
- Northcutt RG & Gans C. The genesis of neural crest and epidermal placodes: a reinterpretation of vertebrate origins. Q Rev Biol 58, 1–28 (1983). - PubMed
MeSH terms
LinkOut - more resources
Full Text Sources
Research Materials
