The importance of targeting signalling mechanisms of the SLC39A family of zinc transporters to inhibit endocrine resistant breast cancer - PubMed (original) (raw)
The importance of targeting signalling mechanisms of the SLC39A family of zinc transporters to inhibit endocrine resistant breast cancer
Samuel Jones et al. Explor Target Antitumor Ther. 2022.
Abstract
Aim: Zinc is a key secondary messenger that can regulate multiple signalling pathways within cancer cells, thus its levels need to be strictly controlled. The Zrt, Irt-like protein (ZIP, SLC39A) family of zinc transporters increase cytosolic zinc from either extracellular or intracellular stores. This study examines the relevance of zinc transporters ZIP7 and ZIP6 as therapeutic targets in tamoxifen resistant (TAMR) breast cancer.
Methods: A series of in vitro assays, including immunohistochemistry, immunofluorescence, flow cytometry, and western blotting were used to evaluate levels and activity of ZIP7 and ZIP6 in models of TAMR and sensitive (MCF-7) breast cancer. Analyses of these transporters in the clinical setting were performed using publicly available online resources: Gene Expression Profiling Interactive Analysis (GEPIA)2 and Kaplan-Meier Plotter (KmPlot).
Results: Both total and activated levels of ZIP7 were significantly elevated in TAMR cells versus responsive MCF-7 cells. This was accompanied by an associated increase in free cytoplasmic zinc leading to amplification of downstream signals. Consistent with our proposed model, activated ZIP6 levels correlated with mitotic cells, which could be efficiently inhibited through use of our anti-ZIP6 monoclonal antibody. Mitotic inhibition translated to impaired proliferation in both models, with TAMR cells displaying increased sensitivity. Analysis of matched tumour and normal breast samples from patients revealed significant increases in both ZIP7 and ZIP6 in tumours, as well as family member ZIP4. Kaplan-Meier analysis revealed that high ZIP7 levels correlated with decreased overall and relapse-free survival (RFS) of patients, including patient groups who had received systemic endocrine therapy or tamoxifen only. In contrast, high ZIP6 levels were significantly linked to improved overall and RFS in all patients, as well as RFS in patients that received systemic endocrine therapy.
Conclusions: TAMR cells displayed increased activity of both ZIP7 and ZIP6 transporters compared to anti-hormone responsive cells, suggesting their potential as novel therapeutic targets following development of resistant disease.
Keywords: SLC39A10; SLC39A6; SLC39A7; STAT3; ZIP6; ZIP7; Zinc transport; tamoxifen resistance.
Conflict of interest statement
Conflicts of interest KMT is a named inventor on a patent describing the use of ZIP6 and ZIP10 antibodies to inhibit mitosis and stands to gain from development. All other authors declare that they have no conflicts of interest.
Figures
Figure 1.
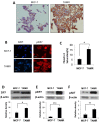
Comparison of ZIP7 levels and activity between anti-hormone responsive MCF-7 and resistant TAMR cell lines. (A) Representative images from immunohistochemistry comparing total ZIP7 levels (brown) between MCF-7 and TAMR cells. Cell nuclei were counterstained with methyl green (blue). Images were obtained at 40× magnification. (B) Immunofluorescence MCF-7 and TAMR cells probed for pZIP7 (red), alongside DAPI (blue). Pictures are representative of individual assessments from replicate experiments (n = 3). Images were obtained using Leica Microscope with a 63× oil immersion lens. Scale bars represent 10 μm. (C) Comparative flow cytometry analysis for levels of free cytoplasmic zinc, as represented by Fluozin-3 fluorescent intensity, between MCF-7 and TAMR cells (n = 3). Examples of western blots of total ZIP7 (D), pZIP7 (E), and major downstream target pAKTS473 (F) including respective densitometry to evaluate protein level signalling changes between MCF-7 and TAMR cells (n = 3). For all data, graphs show mean values plus error bars representing SEM; *P < 0.05, **P < 0.01, ***P < 0.001
Figure 2.
Assessment of ZIP6 activity in regulating mitosis of cancer cells in vitro. (A) Immunofluorescent evaluation of phosphorylated ZIP6 (green) activity in MCF-7 cells, in comparison with pHistoneH3S10 (red) as a marker for cells actively undergoing mitosis, plus additional co-stain for cell nuclei with DAPI (blue). White arrows identify cells undergoing active mitosis. Images are representative of multiple assessment (n = 3). Scale bars represent 10 μm. (B) Cells were treated with 100 nmol/L nocodazole, in the presence or absence of anti-ZIP6 antibody across a dose range, for 20 h prior to examination of mitotic changes through counting cells positive for immunofluorescent detection of pHistoneH3S10 (red). Cells nuclei were co-stained with DAPI (blue). Images are representative of replicate data (n = 3). Quantification of results is shown in (C). Proliferation of MCF-7 (D) and TAMR (E) cells were assessed ± treatment with 4 μg/mL ZIP6 antibody. Cells were counted at 24 h intervals following initial treatment and at day 0 (n = 3). All graphs display mean values with error bars representative of SEM; *P < 0.05, **P < 0.01, ***P < 0.001. Noc: nocodazole; Con: Control
Figure 3.
Differential expression profiles of ZIP family members in paired cancerous versus normal breast tissue, including focused analysis of ZIP4, ZIP7, ZIP6, and ZIP10. (A) Expanded analysis of LIV-1 subfamily members of ZIP-family transporters in matched normal versus tumour patient samples. (B) Focussed analysis of matched tumour and normal breast tissue levels of ZIP4, ZIP7, ZIP6, and ZIP10. Red and grey boxes represent cancerous (T) and matched normal (N) tissue, respectively. All plots were produced by GEPIA 2 server [19] and describe matched gene expression data derived from TCGA and GTEx databases. Data was filtered to show only differential gene expression relationships with a _P-_value threshold of 0.01. Log2FC cut-off was designated as 1. Patient numbers (n) in cancerous (T) and normal (N) cohorts were 1,085 and 291 respectively. TPM: transcripts per million
Figure 4.
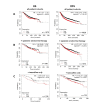
Kaplan-Meier plots describing ZIP7 mRNA expression relationship with OS and RFS, in breast cancer patients. All plots were generated using KMPlot [20] with expression cohorts defined by “auto-selected” cut-offs. Probe sets were optimized via “JetSet” function. Patient cohorts were progressively focused from unrestricted analysis (A), initially into those receiving systemic endocrine therapy (B), before isolating those specifically treated with tamoxifen (C). Hazard ratios (HRs) and significance values (P) are indicated on graphs, with the number of patients included in each analysis (n) noted
Figure 5.
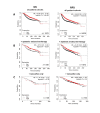
Kaplan-Meier plots describing ZIP6 mRNA expression relationship with OS and RFS, in breast cancer patients. All plots were generated using KmPlot [20] with expression cohorts defined by “auto-selected” cut-offs. Probe sets were optimized via “JetSet” function. Patient cohorts were progressively focused from unrestricted analysis (A), initially into those receiving systemic endocrine therapy (B), before isolating those specifically treated with tamoxifen (C). Hazard ratios (HRs) and significance values (P) are indicated on graphs, with the number of patients included in each analysis (n) noted
Figure 6.
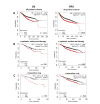
Kaplan-Meier plots describing ZIP4 mRNA expression relationship with OS and RFS, in breast cancer patients. All plots were generated using KmPlot [20] with expression cohorts defined by “auto-selected” cut-offs. Probe sets were optimized via “JetSet” function. Patient cohorts were progressively focused, initially to “include” those non-specific systemic endocrine therapy (B), before isolating those specifically treated with “tamoxifen only” (C). Hazard ratios (HRs) and significance values (P) are indicated on graphs, with the number of patients included in each analysis (n) noted
Figure 7.
Summary of current knowledge of ZIP6, ZIP10, and ZIP7 contribution to tamoxifen-resistant phenotypes in breast cancer. (A) A mechanism for ZIP6:ZIP10 heterodimer-mediated induction of mitosis. Red lines represent the sites of protein cleavage. (B) A mechanism for stimulation of growth factor signalling via ZIP7-mediated intracellular zinc transport. cdh1: E-cadherin; elp1: elongator acetyltransferase complex subunit 1; ER: endoplasmic reticulum; CDK2: cyclin-dependent kinase 2; PI3K: phosphoinositide-3-kinase; mTOR: mammalian target of rapamycin; Src: proto-oncogene tyrosine-protein kinase Src
Similar articles
- Expression of the ZIP/SLC39A transporters in β-cells: a systematic review and integration of multiple datasets.
Lawson R, Maret W, Hogstrand C. Lawson R, et al. BMC Genomics. 2017 Sep 11;18(1):719. doi: 10.1186/s12864-017-4119-2. BMC Genomics. 2017. PMID: 28893192 Free PMC article. Review. - Characterization of Zinc Influx Transporters (ZIPs) in Pancreatic β Cells: ROLES IN REGULATING CYTOSOLIC ZINC HOMEOSTASIS AND INSULIN SECRETION.
Liu Y, Batchuluun B, Ho L, Zhu D, Prentice KJ, Bhattacharjee A, Zhang M, Pourasgari F, Hardy AB, Taylor KM, Gaisano H, Dai FF, Wheeler MB. Liu Y, et al. J Biol Chem. 2015 Jul 24;290(30):18757-69. doi: 10.1074/jbc.M115.640524. Epub 2015 May 12. J Biol Chem. 2015. PMID: 25969539 Free PMC article. - ZIP7-mediated intracellular zinc transport contributes to aberrant growth factor signaling in antihormone-resistant breast cancer Cells.
Taylor KM, Vichova P, Jordan N, Hiscox S, Hendley R, Nicholson RI. Taylor KM, et al. Endocrinology. 2008 Oct;149(10):4912-20. doi: 10.1210/en.2008-0351. Epub 2008 Jun 26. Endocrinology. 2008. PMID: 18583420 - Activated zinc transporter ZIP7 as an indicator of anti-hormone resistance in breast cancer.
Ziliotto S, Gee JMW, Ellis IO, Green AR, Finlay P, Gobbato A, Taylor KM. Ziliotto S, et al. Metallomics. 2019 Sep 1;11(9):1579-1592. doi: 10.1039/c9mt00136k. Epub 2019 Sep 4. Metallomics. 2019. PMID: 31483418 Free PMC article. - Zinc Transporters and the Progression of Breast Cancers.
Takatani-Nakase T. Takatani-Nakase T. Biol Pharm Bull. 2018;41(10):1517-1522. doi: 10.1248/bpb.b18-00086. Biol Pharm Bull. 2018. PMID: 30270320 Review.
Cited by
- Zinc and Diabetes: A Connection between Micronutrient and Metabolism.
Ahmad R, Shaju R, Atfi A, Razzaque MS. Ahmad R, et al. Cells. 2024 Aug 15;13(16):1359. doi: 10.3390/cells13161359. Cells. 2024. PMID: 39195249 Free PMC article. Review. - Comparison of Three Low-Molecular-Weight Fluorescent Probes for Measuring Free Zinc Levels in Cultured Mammary Cells.
Hübner C, Keil C, Jürgensen A, Barthel L, Haase H. Hübner C, et al. Nutrients. 2023 Apr 13;15(8):1873. doi: 10.3390/nu15081873. Nutrients. 2023. PMID: 37111093 Free PMC article. - Prognostic and Predictive Value of LIV1 Expression in Early Breast Cancer and by Molecular Subtype.
de Nonneville A, Finetti P, Boudin L, Denicolaï E, Birnbaum D, Mamessier E, Bertucci F. de Nonneville A, et al. Pharmaceutics. 2023 Mar 14;15(3):938. doi: 10.3390/pharmaceutics15030938. Pharmaceutics. 2023. PMID: 36986799 Free PMC article. - Zinc in Human Health and Infectious Diseases.
Maywald M, Rink L. Maywald M, et al. Biomolecules. 2022 Nov 24;12(12):1748. doi: 10.3390/biom12121748. Biomolecules. 2022. PMID: 36551176 Free PMC article. Review. - Zinc's Association with the CmPn/CmP Signaling Network in Breast Cancer Tumorigenesis.
Renteria M, Belkin O, Aickareth J, Jang D, Hawwar M, Zhang J. Renteria M, et al. Biomolecules. 2022 Nov 11;12(11):1672. doi: 10.3390/biom12111672. Biomolecules. 2022. PMID: 36421686 Free PMC article. Review.
References
LinkOut - more resources
Full Text Sources
Miscellaneous


