Expression of Ectonucleoside Triphosphate Diphosphohydrolase 2 (NTPDase2) Is Negatively Regulated Under Neuroinflammatory Conditions In Vivo and In Vitro - PubMed (original) (raw)
Expression of Ectonucleoside Triphosphate Diphosphohydrolase 2 (NTPDase2) Is Negatively Regulated Under Neuroinflammatory Conditions In Vivo and In Vitro
Milorad Dragic et al. ASN Neuro. 2022 Jan-Dec.
Abstract
Ectonucleoside triphosphate diphosphohydrolase 2 (NTPDase2) hydrolyzes extracellular ATP to ADP, which is the ligand for P2Y1,12,13 receptors. The present study describes the distribution of NTPDase2 in adult rat brains in physiological conditions, and in hippocampal neurodegeneration induced by trimethyltin (TMT). The study also describes the regulation of NTPDase2 by inflammatory mediators in primary astrocytes and oligodendroglial cell line OLN93. In physiological conditions, NTPDase2 protein was most abundant in the hippocampus, where it was found in fibrous astrocytes and synaptic endings in the synaptic-rich hippocampal layers. In TMT-induced neurodegeneration, NTPDase2-mRNA acutely decreased at 2-dpi and then gradually recovered to the control level at 7-dpi and 21-dpi. As determined by immunohistochemistry and double immunofluorescence, the decrease was most pronounced in the dentate gyrus (DG), where NTPDase2 withdrew from the synaptic boutons in the polymorphic layer of DG, whereas the recovery of the expression was most profound in the subgranular layer. Concerning the regulation of NTPDase2 gene expression, proinflammatory cytokines IL-6, IL-1β, TNFα, and IFNγ negatively regulated the expression of NTPDase2 in OLN93 cells, while did not altering the expression in primary astrocytes. Different cell-intrinsic stressors, such as depletion of intracellular energy store, oxidative stress, endoplasmic reticulum stress, and activation of protein kinase C, also massively disturbed the expression of the NTPDase2 gene. Together, our results suggest that the expression and the activity of NTPDase2 transiently cease in neurodegeneration and brain injury, most likely as a part of the acute adaptive response designed to promote cell defense, survival, and recovery.
Keywords: ectonucleoside triphosphate diphosphohydrolase 2 (NTPDase2); hippocampus; neuroinflammation; purinergic signaling; trimethyltin-model of neurodegeneration.
Conflict of interest statement
Declaration of Conflicting Interests: The author(s) declared no potential conflicts of interest with respect to the research, authorship, and/or publication of this article.
Figures
Figure 1.
a: Crude membrane fractions isolated from the olfactory bulb (Olf), cortex (Ctx), hippocampus (Hip), brain stem (BS), cerebellum (Crb), and caudate-putamen (CPu), resolved by SDS-PAGE and probed with rabbit anti-rat NTPDase2 antisera (BZ3-4F/rN2-6L). Dash denotes the position of the specific 55 kDa band. b: Mean NTPDase2/β-actin protein abundance, expressed relative to Ctx (arbitrarily defined as 1.0) ± SEM (from n = 4 determinations performed with two independent P2 preparations). Significance is shown inside the graph: *p < 0.05. c: Immunodetection of NTPDase2 in the plasma membrane (PM), synaptic membrane (SPM), and glial membrane (Glio) fractions isolated from the hippocampal tissue.
Figure 2.
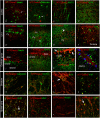
a: immunohistochemical labeling of NTPDase2 at coronal forebrain section. The white frames denote areas enlarged at b: The fimbria (fi); c: The third cerebral ventricle; d: Hippocampal CA1 sector; e: Dentate gyrus/Hilus; f: Midbrain tanycytes.
Figure 3.
Double immunofluorescence labeling showing immunoreaction corresponding to NTPDase2 (red) and GFAP (green) in distinct brain areas. Arrows point to colocalization of NTPDase2/GFAP-ir (yellow). Abbreviations: cp = choroid plexus; 3V = Third ventricle; 4V = Fourth ventricle. Magnification: ×400 (A–M) and ×600 (N–R).
Figure 4.
Double immunofluorescence labeling directed to NTPDase2 (red) and specific cell markers (green) in distinct brain regions. General neuronal marker NeuN; specific neuronal markers, calbindin, MAP2, Doublecortin (DCX); Parvalbumin (PV), Synaptophysin (SYN); glial cell markers, vimentin – VIM, S100, nestin, NG2, myelin basic protein (MBP). Arrows point to colocalization between the signals (yellow).
Figure 5.
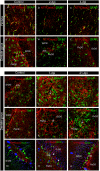
Immunohistochemical labeling of NTPDase2 at coronal hippocampal sections after TMT exposure. Abbreviations: alv = Alveus; CC = corpus callosum; DG = Dentate gyrus; GrDG = granule cell layer; fi = Fimbria; MHb = Medial habenula; MoDG = molecular layer; PoDG = Polymorphic layer; Py = Pyramidal cell layer; sm = Stria medullaris; Or = Stratum, oriens; Rad = Stratum radiatum; 3V = Third ventricle. Frame in (K) shows area enlarged in (L). Arrow points to NTPDase2-ir presynaptic boutons terminating within PoDG. Magnification: ×50 (a, d, g, j), ×200 (b, c, e, f, h, i, k, l).
Figure 6.
Immunofluorescence labeling directed to NTPDase2 (red) and cell-specific markers in the hippocampus and dentate gyrus 2-7-dpi after TMT exposure. A–L: Double NTPDase2/GFAP immunofluorescence labeling; M–O: NTPDase2/DCX/PV immunofluorescence labeling. Arrows point to NTPDase2-ir elements in the DG.
Figure 7.
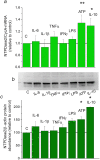
Regulation of NTPDase2 expression by inflammatory mediators in primary cortical astrocytes. a: NTPDase2/CycA-mRNA abundance in primary astrocytes treated with inflammatory factors for 8 h, expressed relative to non-treated control culture, ± SEM (from n ≥ 3 determinations, performed in two independent culture preparations and mRNA extractions. b: Representative immunoblot membrane and c: quantification of NTPDase2/β-actin protein abundance in astrocytes treated with inflammatory factors for 24 h, expressed relative to non-treated control culture ± SEM (from n = 3 determinations, performed with two independent culture preparations). Significance shown inside the graphs: *p < 0.05.
Figure 8.
Regulation of NTPDase2 in OLN cell line. NTPDase2/CycA-mRNA abundance in OLN cells treated with (a) inflammatory mediators and (b) cell-intrinsic stressors, for 8 h. Results are expressed relative to non-treated control culture, ± SEM (from n = 3 determinations, performed in two independent culture preparations). Significance is shown inside the graph: *p < 0.01.
Similar articles
- Nucleoside triphosphate diphosphohydrolase-2 (NTPDase2/CD39L1) is the dominant ectonucleotidase expressed by rat astrocytes.
Wink MR, Braganhol E, Tamajusuku AS, Lenz G, Zerbini LF, Libermann TA, Sévigny J, Battastini AM, Robson SC. Wink MR, et al. Neuroscience. 2006;138(2):421-32. doi: 10.1016/j.neuroscience.2005.11.039. Epub 2006 Jan 18. Neuroscience. 2006. PMID: 16414200 - Regulation of P2Y1 receptor-mediated signaling by the ectonucleoside triphosphate diphosphohydrolase isozymes NTPDase1 and NTPDase2.
Alvarado-Castillo C, Harden TK, Boyer JL. Alvarado-Castillo C, et al. Mol Pharmacol. 2005 Jan;67(1):114-22. doi: 10.1124/mol.104.006908. Epub 2004 Oct 20. Mol Pharmacol. 2005. PMID: 15496502 - Down-regulation of NTPDase2 and ADP-sensitive P2 Purinoceptors Correlate with Severity of Symptoms during Experimental Autoimmune Encephalomyelitis.
Jakovljevic M, Lavrnja I, Bozic I, Savic D, Bjelobaba I, Pekovic S, Sévigny J, Nedeljkovic N, Laketa D. Jakovljevic M, et al. Front Cell Neurosci. 2017 Oct 30;11:333. doi: 10.3389/fncel.2017.00333. eCollection 2017. Front Cell Neurosci. 2017. PMID: 29163045 Free PMC article. - Expression of the ecto-ATPase NTPDase2 in the germinal zones of the developing and adult rat brain.
Braun N, Sévigny J, Mishra SK, Robson SC, Barth SW, Gerstberger R, Hammer K, Zimmermann H. Braun N, et al. Eur J Neurosci. 2003 Apr;17(7):1355-64. doi: 10.1046/j.1460-9568.2003.02567.x. Eur J Neurosci. 2003. PMID: 12713638 - NTPDase2 and purinergic signaling control progenitor cell proliferation in neurogenic niches of the adult mouse brain.
Gampe K, Stefani J, Hammer K, Brendel P, Pötzsch A, Enikolopov G, Enjyoji K, Acker-Palmer A, Robson SC, Zimmermann H. Gampe K, et al. Stem Cells. 2015 Jan;33(1):253-64. doi: 10.1002/stem.1846. Stem Cells. 2015. PMID: 25205248 Free PMC article.
Cited by
- Microglia sense astrocyte dysfunction and prevent disease progression in an Alexander disease model.
Saito K, Shigetomi E, Shinozaki Y, Kobayashi K, Parajuli B, Kubota Y, Sakai K, Miyakawa M, Horiuchi H, Nabekura J, Koizumi S. Saito K, et al. Brain. 2024 Feb 1;147(2):698-716. doi: 10.1093/brain/awad358. Brain. 2024. PMID: 37955589 Free PMC article. - Extracellular Purine Metabolism-Potential Target in Multiple Sclerosis.
Laketa D, Lavrnja I. Laketa D, et al. Mol Neurobiol. 2024 Oct;61(10):8361-8386. doi: 10.1007/s12035-024-04104-9. Epub 2024 Mar 18. Mol Neurobiol. 2024. PMID: 38499905 Review.
References
Publication types
MeSH terms
Substances
LinkOut - more resources
Full Text Sources
Molecular Biology Databases
Research Materials


