Comprehensive Analyses of Immune Subtypes of Stomach Adenocarcinoma for mRNA Vaccination - PubMed (original) (raw)
Comprehensive Analyses of Immune Subtypes of Stomach Adenocarcinoma for mRNA Vaccination
Weiqiang You et al. Front Immunol. 2022.
Abstract
Background: Although messenger RNA (mRNA) vaccines have unique advantages against multiple tumors, mRNA vaccine targets in stomach adenocarcinoma (STAD) remain unknown. The potential effectiveness of mRNA vaccines is closely associated with the tumor immune infiltration microenvironment. The present study aimed to identify tumor antigens of STAD as mRNA vaccine targets and systematically determine immune subtypes (ISs) of STAD that might be suitable for immunotherapy.
Methods: Gene expression profiles and clinical data of patients with gastric cancer were downloaded from The Cancer Genome Atlas (TCGA; n = 409) and the Gene Expression Omnibus (GEO; n = 433), and genomic data were extracted from cBioPortal. Differential gene expression was analyzed using the limma package, genetic alterations were visualized using maftools, and prognosis was analyzed using ToPP. Correlations between gene expression and immune infiltration were calculated using TIMER software, and potential ISs were identified using ConsensusClusterPlus. Functional enrichment was analyzed in clusterProfiler, and r co-expression networks were analyzed using the weighted gene co-expression network analysis (WGCNA) package in R.
Results: Overexpression of the prognostic and highly mutated antigens ADAMTS18, COL10A1, PPEF1, and STRA6 was associated with infiltration by antigen-presenting cells in STAD. Five ISs (IS1-IS5) in STAD with distinct prognoses were developed and validated in TCGA and GEO databases. The tumor mutational burden and molecular and clinical characteristics significantly differed among IS1-IS5. Both IS1 and IS2 were associated with a high mutational burden, massive infiltration by immune cells, especially antigen-presenting cells, and better survival compared with the other subtypes. Both IS4 and IS5 were associated with cold immune infiltration and correlated with advanced pathological stages. We analyzed the immune microenvironments of five subtypes of immune modulators and biomarkers to select suitable populations for mRNA vaccination and established four co-expressed key modules to validate the characteristics of the ISs. Finally, the correlation of these four mRNA vaccine targets with the transcription factors of DC cells, including BATF3, IRF4, IRF8, ZEB2, ID2, KLF4, E2-2, and IKZF1, were explored to reveal the underlying mechanisms.
Conclusions: ADAMTS18, COL10A1, PPEF1, and STRA6 are potential mRNA vaccine candidates for STAD. Patients with IS1 and IS2 are suitable populations for mRNA vaccination immunotherapy.
Keywords: immune subtype; immunotherapy; mRNA vaccine; stomach adenocarcinoma; tumor immune microenvironment.
Copyright © 2022 You, Ouyang, Cai, Chen and Wu.
Conflict of interest statement
The authors declare that the research was conducted in the absence of any commercial or financial relationships that could be construed as a potential conflict of interest.
Figures
Figure 1
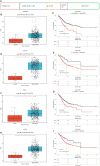
Identification of potential prognostic markers for STAD. (A) Statistical data of differentially expressed, high-frequency mutation, and prognosis-related genes in TCGA cohort. (B, D, F, H) ADAMTS18, COL10A1, PPEF1, and STRA6 are differentially expressed in STAD compared with that in adjacent normal tissues. (C, E, G, I) ADAMTS18, COL10A1, PPEF1, and STRA6 are risk factors for poor prognoses.
Figure 2
Correlations between gene expression and immune cells. Expression of ADAMTS18 (A), COL10A1 (B), PPEF1 (C), and STRA6 (D) correlates with six immune cell types (B cells, CD8+ T cells, CD4+ T cells, macrophages, neutrophils, and dendritic cells).
Figure 3
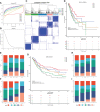
Identification of immune subtypes for STAD. (A) Consensus cumulative distribution function for K = 2–10. (B) Delta area for K = 2–10. (C) Immune subtypes (IS1–IS5) in TCGA cohort at K = 5. (D) Prognosis associated with five immune subtypes in TCGA cohort. (E, F) Distribution of IS1–IS5 across gastric cancer stages (E) and grades (F) in TCGA cohort. (G) Prognosis associated with five immune subtypes in GEO cohort. (H, I) Distribution of IS1–IS5 across gastric cancer N (H) and T (I) stages in GEO cohort.
Figure 4
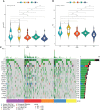
Association between immune subtypes and tumor mutational burden. (A) Tumor mutational burden, (B) number of mutated genes, and (C) top 20 high-frequency mutation genes in IS1–IS5.
Figure 5
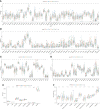
Immune checkpoints (ICPs), immunogenic cell death (ICD) regulators, and immune infiltration related to immune subtypes. (A, B) Expression of 43 ICP-related genes significantly differs in all subgroups in TCGA (A) and GEO (B) cohorts. (C, D) Significantly different expression of ICD-related genes in TCGA (C), n = 20) and GEO cohort (D), n = 23). (E, F) Differences of immune-infiltrating cells among five subgroups performed by EPIC (E) and McP-Counter (F). *p < 0.05, **p < 0.01, ***p < 0.001, and ****p < 0.0001.
Figure 6
Identification of immune cells in immune subtypes (ISs) for STAD. (A) Heatmap of ssGSEA showing scores for types of immune cells with IS1–IS5 in TCGA cohort. (B) Immune cell types significantly differ between IS1+IS2 and IS4+IS5 groups in TCGA cohort. (C) Distribution of IS1–IS5 across C1–C6 in TCGA cohort. (D) Heatmap of ssGSEA showing scores for immune cell types with IS1–IS5 in GEO cohort. (E) Immune cell types significantly differ between IS1+IS2 and IS4+IS5 groups in GEO cohort. *p < 0.05, **p < 0.01, ***p < 0.001, and ****p < 0.0001.
Figure 7
Co-expression network analysis of immune-related genes in STAD. (A) Selection of soft threshold for power. (B) Co-expression network modules and (C) number of immune-related genes in each module. (D) Enrichment scores for each module in IS1–IS5 immune subtypes. (E) Prognosis for each module in TCGA cohort. (F) Blue module, KEGG pathway enrichment. (G) Overall survival curves differ between low and high blue modules. *p < 0.05, **p < 0.01, ***p < 0.001, and ****p < 0.0001.
Figure 8
A brief diagrammatic figure to summarize our findings.
Similar articles
- Bioinformatics analyses for the identification of tumor antigens and immune subtypes of gastric adenocarcinoma.
Wei S, Sun Q, Chen J, Li X, Hu Z. Wei S, et al. Front Genet. 2022 Dec 12;13:1068112. doi: 10.3389/fgene.2022.1068112. eCollection 2022. Front Genet. 2022. PMID: 36579327 Free PMC article. - Identification of tumor antigens and immune subtypes of pancreatic adenocarcinoma for mRNA vaccine development.
Huang X, Zhang G, Tang T, Liang T. Huang X, et al. Mol Cancer. 2021 Mar 1;20(1):44. doi: 10.1186/s12943-021-01310-0. Mol Cancer. 2021. PMID: 33648511 Free PMC article. - Recognition of Tumor-Associated Antigens and Immune Subtypes in Glioma for mRNA Vaccine Development.
Ma S, Ba Y, Ji H, Wang F, Du J, Hu S. Ma S, et al. Front Immunol. 2021 Sep 17;12:738435. doi: 10.3389/fimmu.2021.738435. eCollection 2021. Front Immunol. 2021. PMID: 34603319 Free PMC article. - Identification and characterization of nucleotide metabolism and neuroendocrine regulation-associated modification patterns in stomach adenocarcinoma with auxiliary prognostic assessment and immunotherapy response prediction.
Zhang Y, Zeng L, Lin D, Chang G, Zeng Y, Xia Y. Zhang Y, et al. Front Endocrinol (Lausanne). 2023 Jan 16;13:1076521. doi: 10.3389/fendo.2022.1076521. eCollection 2022. Front Endocrinol (Lausanne). 2023. PMID: 36726460 Free PMC article. Review. - The role of immune subtyping in glioma mRNA vaccine development.
Guterres A, Abrahim M, da Costa Neves PC. Guterres A, et al. Immunotherapy. 2023 Sep;15(13):1057-1072. doi: 10.2217/imt-2023-0027. Epub 2023 Jul 11. Immunotherapy. 2023. PMID: 37431617 Review.
Cited by
- Bioinformatics analyses for the identification of tumor antigens and immune subtypes of gastric adenocarcinoma.
Wei S, Sun Q, Chen J, Li X, Hu Z. Wei S, et al. Front Genet. 2022 Dec 12;13:1068112. doi: 10.3389/fgene.2022.1068112. eCollection 2022. Front Genet. 2022. PMID: 36579327 Free PMC article. - mRNA-From COVID-19 Treatment to Cancer Immunotherapy.
Krause W. Krause W. Biomedicines. 2023 Jan 22;11(2):308. doi: 10.3390/biomedicines11020308. Biomedicines. 2023. PMID: 36830845 Free PMC article. Review. - Mannan-Decorated Lipid Calcium Phosphate Nanoparticle Vaccine Increased the Antitumor Immune Response by Modulating the Tumor Microenvironment.
Wu L, Yang L, Qian X, Hu W, Wang S, Yan J. Wu L, et al. J Funct Biomater. 2024 Aug 16;15(8):229. doi: 10.3390/jfb15080229. J Funct Biomater. 2024. PMID: 39194667 Free PMC article. Review. - Expression and prognosis of ADAMTS18 in different tumors.
Guo W, Zhang Y. Guo W, et al. Front Oncol. 2024 Feb 28;14:1347633. doi: 10.3389/fonc.2024.1347633. eCollection 2024. Front Oncol. 2024. PMID: 38482210 Free PMC article. Review. - Identification and validation of subclusters of papillary thyroid carcinoma based on Human Phenotype Ontology.
Xuan Z, Hu X, Xu T, Liu Y, Pan Z, Ge M, Díez JJ, Huang P, Xu J, Tan Z. Xuan Z, et al. Gland Surg. 2023 May 30;12(5):664-676. doi: 10.21037/gs-23-124. Epub 2023 May 18. Gland Surg. 2023. PMID: 37284705 Free PMC article.
References
- Allemani C, Weir HK, Carreira H, Harewood R, Spika D, Wang X-S, et al. . Global Surveillance of Cancer Survival 1995–2009: Analysis of Individual Data for 25 676 887 Patients From 279 Population-Based Registries in 67 Countries (CONCORD-2). Lancet (2015) 385(9972):977–1010. doi: 10.1016/s0140-6736(14)62038-9 - DOI - PMC - PubMed
Publication types
MeSH terms
Substances
LinkOut - more resources
Full Text Sources
Medical
Research Materials


