Discovery, structure and mechanism of a tetraether lipid synthase - PubMed (original) (raw)
Discovery, structure and mechanism of a tetraether lipid synthase
Cody T Lloyd et al. Nature. 2022 Sep.
Abstract
Archaea synthesize isoprenoid-based ether-linked membrane lipids, which enable them to withstand extreme environmental conditions, such as high temperatures, high salinity, and low or high pH values1-5. In some archaea, such as Methanocaldococcus jannaschii, these lipids are further modified by forming carbon-carbon bonds between the termini of two lipid tails within one glycerophospholipid to generate the macrocyclic archaeol or forming two carbon-carbon bonds between the termini of two lipid tails from two glycerophospholipids to generate the macrocycle glycerol dibiphytanyl glycerol tetraether (GDGT)1,2. GDGT contains two 40-carbon lipid chains (biphytanyl chains) that span both leaflets of the membrane, providing enhanced stability to extreme conditions. How these specialized lipids are formed has puzzled scientists for decades. The reaction necessitates the coupling of two completely inert sp3-hybridized carbon centres, which, to our knowledge, has not been observed in nature. Here we show that the gene product of mj0619 from M. jannaschii, which encodes a radical S-adenosylmethionine enzyme, is responsible for biphytanyl chain formation during synthesis of both the macrocyclic archaeol and GDGT membrane lipids6. Structures of the enzyme show the presence of four metallocofactors: three [Fe4S4] clusters and one mononuclear rubredoxin-like iron ion. In vitro mechanistic studies show that Csp3-Csp3 bond formation takes place on fully saturated archaeal lipid substrates and involves an intermediate bond between the substrate carbon and a sulfur of one of the [Fe4S4] clusters. Our results not only establish the biosynthetic route for tetraether formation but also improve the use of GDGT in GDGT-based paleoclimatology indices7-10.
© 2022. The Author(s).
Conflict of interest statement
The authors declare no competing interests.
Figures
Fig. 1. Structures of saturated isoprenoid-based archaeal lipids.
a–c, Structures of a GDGT (a), diether archaeal lipid (archaeol when R = H and archaetidylglycerol when R = glycerol) (b) and macrocyclic archaeol (c). Archaeols contain two 20-carbon chains called phytanyl chains, whereas archaeol lipid macrocycles contain one (observed in macrocyclic archaeols) or two (observed in GDGTs) 40-carbon chains called biphytanyl chains. The red C–C bond shown in the archaeol diether macrocycle (b) and GDGT (c) is formed during biphytanyl chain synthesis. All carbon chains are appended to an _sn_-glycero-1-phophate backbone.
Fig. 2. X-ray crystal structure of GDGT–MAS with bound cofactors and archaeal lipid substrate.
a, Overall architecture of GDGT–MAS showing the rubredoxin domain (light pink), the N-terminal auxiliary cluster domain (wheat), the RS core domain (light blue) and the C-terminal auxiliary cluster domain (teal). The GDGT–MAS archaeal lipid complex contains one Fe ion, three [Fe4S4] clusters, methionine, 5′-dAH and two archaeal lipids: L1P and AG. Inlayed panels are 2_F_ o_–_F c maps contoured to 1.5σ, showing electron density for the three novel coordination spheres observed in the auxiliary metallocofactors. C9X2C12X20C33X2H36 coordination motif and the rubredoxin iron ion of the rubredoxin domain (top). [Fe4S4]N cluster coordinated by the C73, C77, C80 and a conserved histidine (middle). Coordination sphere of the [Fe4S4]C cluster with the labile Met439 in the Met-on configuration (bottom). TIM, triosephosphate isomerase. b, Cavity map of the GDGT–MAS active site reveals a hydrophobic pocket that narrows to a 5.8 Å-wide channel near the 5′-carbon of 5′-dAH. c, F o_–_F c map contoured to 3.0σ, showing electron density for two archaeal lipids bound in the active site. The terminal carbon of AG is positioned 3.5 Å from the 5′-carbon of 5′-dAH, which suggests H• abstraction occurs on a terminal carbon of the phytanyl chain.
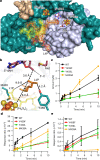
Fig. 3. Structural insight into the mechanism of biphytanyl chain formation.
a, The active site of GDGT–MAS binds two archaeal lipids, L1P (yellow) and AG (orange), and directs one carbon chain from each lipid into separate pockets. The pocket that leads to 5′-dAH and the [Fe4S4]C cluster is the proposed reaction centre of GDGT–MAS. b, GDGT–MAS catalyses the formation of the biphytanyl chain by coupling two terminal Csp3 carbons, which our substrate-bound structure indicates are 9.9 Å apart. Generation of the Csp3–Csp3 bond would necessitate two sequential C–H activations and storage of a high-energy substrate radical intermediate. The substrate-bound complex suggests two potential mechanisms for storage of the high-energy radical intermediate: formation of (1) a terminal olefin and (2) an [Fe4S4]C-substrate intermediate. In the first mechanism, substrate radical formation leads to loss of an electron and a proton to yield a terminal olefin intermediate on one chain. Tyr459 is 4.2 Å away from the terminal carbon of the substrate and is strictly conserved, suggesting that tyrosinate might facilitate this proposed mechanism. In the second mechanism, the substrate radical might couple with the [Fe4S4]C cluster to yield an S–C bond intermediate. The sulfur atom of the [Fe4S4]C is 8.0 Å from the high-energy substrate radical intermediate. c–e, Time-dependent production of 5′-dAH (c), mAG (d) and GDGT (e) of in vitro activity assays containing either wild-type or mutant (Y459F, Y459L and M439A) forms of GDGT–MAS. These mutagenesis experiments reveal that Y459 does not have an essential role in the GDGT–MAS mechanism, which suggests that the radical intermediate is stabilized by interaction with the [Fe4S4]C cluster. The error bars represent one standard deviation for reactions conducted in triplicate, with the centre representing the mean.
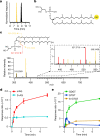
Fig. 4. Stabilization of a high-energy radical intermediate via S–C bond formation.
a, Liquid chromatography–MS extracted-ion chromatogram of the GDGT–MAS reaction showing retention time of AG substrate (black trace) at 9.1 min and lipid IV (yellow trace) at 7.8 min. b, Structure of thiolated AG (lipid IV, S–AG). c, Structural characterization of S–AG by tandem MS/MS, with dashed lines representing the fragmented bond. Fragmentation of S–AG predominantly cleaves the ether bond, resulting in a 313.2929 m/z daughter ion, indicating the observation of a thiolated phytanyl chain. In addition, less favoured fragmentation patterns (present in the dashed box) reveal a similar fragmentation pattern to the AG substrate, in which the presence of the 527.3718 m/z daughter ion indicates the neutral loss of the thiolated phytanyl chain, whereas the 559.3439 m/z daughter ion indicates the neutral loss of the phytanyl chain. Yellow fragments indicate sulfur-containing daughter ions of S-AG; red fragments are nonsulfur-containing daughter ions of S-AG. d,e, Time-dependent production of the S–C bond intermediates, S–AG and S–GTGT, observed during in vitro activity assays with wild-type GDGT–MAS and limiting SAM, suggests that S–AG is the intermediate for mAG and GTGT synthesis and that S–GTGT is the intermediate for GDGT synthesis. Production of S–AG (teal trace) compared with the formation of mAG (red trace) (d), and production of S–GTGT (brown trace) from GTGT (blue trace) towards the formation of GDGT (green trace) (e) are shown. The error bars represent one standard deviation for reactions conducted in triplicate, with the centre representing the mean.
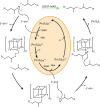
Fig. 5. Proposed reaction mechanism for the formation of the biphytanyl chain.
Formation of the biphytanyl chain from two phytanyl chains (R = remaining molecule of archaeol; Fig. 1b.) The orange circle indicates the chemistry performed by the [Fe4S4]RS. The dashed green arrow indicates the reaction catalysed by GDGT–MAS, with the C–C bond formed during the formation of the biphytanyl chain highlighted in red.
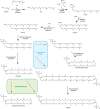
Extended Data Fig. 1. Saturated and unsaturated biosynthesis pathways for biphytanyl chain formation in macrocyclic Archaeol and GDGT.
Archaeal membrane lipid biosynthesis is well established through formation of the fully saturated diether lipid Archaeol. However, how the biphytanyl chain is formed is unknown. Two potential pathways for generating the biphytanyl chain have been proposed: a pathway involving a saturated substrate and a pathway involving an unsaturated substrate, both of which entail the formation of a Csp3-Csp3 bond between the termini of two lipid chains. The distinction between the two routes, however, is when the biphytanyl chain is formed in relation to saturation of the lipid chain by geranylgeranyl reductase (GGR). In the unsaturated route, the biphytanyl chain is formed prior to chain saturation by GGR. Therefore, the substrate for the reaction is an unsaturated lipid: digeranylgeranyl glycerol phosphate (DGGGP) with R=H or a polar headgroup. In the saturated route, the fully saturated lipid is formed by GGR-mediated chain reduction prior to biphytanyl chain formation. Therefore, the substrate for the reaction contains fully saturated chains: archaeol when R=H and archaetidylglycerol when R=glycerol. Abbreviations: dimethylallyl diphosphate (DMAPP), isopentenyl pyrophosphate (IPP), geranylgeranyl pyrophosphate synthase (GGPP synthase), geranylgeranyl pyrophosphate (GGP), _sn_-glycerol-1-phosphate (G1P), geranylgeranyl glycerol phosphate (GGGP), digeranylgeranyl glycerol phosphate (DGGGP), cytidine diphosphate (CDP), glycerol dibiphytanyl glycerol tetraether (GDGT).
Extended Data Fig. 2. Topology and Ribbon diagrams of GDGT–MAS illustrating domain architecture.
a, Topology diagram of GDGT–MAS. The dots represent atoms of cofactors and metal-coordinating residues. For the metallocofactors, the orange dots represent iron ions while the yellow dots indicate sulfide ions. On the peptide, cysteine ligands are modeled as yellow dots while the blue dots in the β turn of the rubredoxin domain and the loop region of the N-terminal auxiliary cluster domain represent histidine ligands. The green dot in the C-terminal auxiliary cluster domain is the labile methionine ligand, Met439. b–e, Ribbon diagram of b, C-terminal auxiliary cluster domain (teal), c, RS core or ¾ TIM barrel domain (light blue), d, rubredoxin domain (light pink), and e, N-terminal auxiliary cluster domain (wheat).
Extended Data Fig. 3. Coordination environment of the RS [Fe4S4] cluster and the three novel metallocofactors observed in GDGT–MAS.
a, 2Fo-Fc map contoured to 1.5σ (gray mesh) showing electron density for the rubredoxin coordination motif, C9X2C12X20C33X2H36, and the rubredoxin iron ion of the rubredoxin domain. b, The novel coordination sphere observed in the N-terminal auxiliary [Fe4S4] ([Fe4S4]N) cluster ligated by C73, C77, C80 and a conserved histidine. Electron density is shown with 2_F_ o -F c map contoured to 1.5σ (gray mesh). c, 2_F_ o -F c map contoured to 1.5σ (gray mesh) showing electron density of the [Fe4S4]RS cluster with Met bound to the unique iron. d–e, 2_F_ o -F c map contoured to 1.5σ showing electron density for the coordination sphere of the [Fe4S4]C cluster with the labile Met439 ligand in the Met-on (d, observed in 7TOM) or Met-off (e, observed in 7TOL) configurations. In the Met-off state, the uncoordinated iron ion of the [Fe4S4]C cluster is ligated by a reagent in the crystallographic condition, thiocyanate (SCN). f–g, F o -F c omit map contoured to 3.0σ showing electron density for the labile Met439 ligand in the Met-on (f) or Met-off (g) configurations.
Extended Data Fig. 4. Binding of 5′-dAH and methionine to the RS [Fe4S4].
a, F o -F c omit map contoured to 3.0σ (green mesh) showing electron density for 5′-dAH and methionine. b, Network of H-bonds that orchestrate binding of 5′-dAH. The adenine moiety of 5′-dAH is recognized by four H-bonds and the ribose moiety makes two H-bonds with four residues (Phe106, Arg210, Gln268, and Ser271) of the RS core domain. As observed in other structures of RS enzymes, N7 of adenine interacts with a nitrogen from the peptide backbone (Phe106) in the loop that resides between β1 and α1 of the ¾ TIM barrel. This loop also contains the CX3CX2C RS motif. N3 of the adenine ring and the ribose ring oxygen H-bond with Gln268 while N1 and N6 H-bond to the peptide backbone of Ser271. Interestingly, we predict that Gln268 and Ser271 reside on a loop region that regulates the active site opening for SAM, 5′-dAH, and Met (shown in Extended Data Fig. 8) Additionally, binding of 5′-dAH is further stabilized by H-bonding with three structurally conserved waters that interact with residues Tyr195, Asp199, Val236, Thr238, Thr273, and Arg275 (not shown). c, In canonical RS fashion, methionine coordinates to the unique iron in a bidentate manner via the carboxylate and amine functional groups. Gly145 forms an H-bond with the amine moiety to orient the ligand. Additionally, a water bridge is formed between the carboxylate group and the ribose ring of 5′-dAH.
Extended Data Fig. 5. Lipid binding and electron density within the GDGT–MAS active site.
a, The active site of GDGT–MAS contains two distinct hydrophobic pockets (colored light pink and cyan). GDGT–MAS directs one carbon chain from each lipid into separate hydrophobic pockets. The pocket that leads to 5′-dAH and the [Fe4S4]C cluster (light pink) is the proposed reaction center of GDGT–MAS. b, GDGT–MAS binds the polar headgroup of lipids in a nonspecific fashion, which would allow the binding of lipids independent of the polar headgroups. The active site pockets that bind the headgroups do not make any direct H-bonds with L1P or L4P. Instead, an H-bonding network with several water molecules mediates binding of the headgroup to the protein. This large and versatile headgroup binding pocket would allow GDGT–MAS to accommodate larger polar headgroups, such as inositol, which suggests that GDGT–MAS catalyzes the formation GDGTs with varying headgroups. c, F o -F c omit map of GDGT–MAS with bound bacterial lipids contoured to 3.0σ showing electron density that supports the modeling of two molecules of phosphatidic acid (1,2-dipalmitoyl-s_n_-glycero-3-phosphate, LPP). d, F o -F c omit map of GDGT–MAS with bound archaeal lipids contoured to 3.0σ showing electron density of bound archaeol (2,3-di-_O_-phytanyl-s_n_-glycero-1-phosphate, L1P) and archaetidylglycerol (AG or L4P, 2,3-di-_O_-phytanyl-s_n_-glycero-1-phosphate-3′-s_n_-glycerol).
Extended Data Fig. 6. Native protein mass spectra of GDGT–MAS revealing apo, holo, and enzyme-ligand complexes.
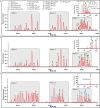
Panels a–c show the deconvoluted native protein mass spectra and high-resolution ejection mass spectra for a. as-isolated GDGT–MAS, b, Ma lipid-exchanged GDGT–MAS, c. AG lipid-exchanged GDGT–MAS. In each panel, the deconvoluted native protein mass spectra from 59,750 Da to 62,500 Da spans the bottom of the panel while the high-resolution ejection mass spectra of bound lipids are inlayed at the top right corner. Region 1 of the deconvoluted native protein mass spectra shows various iron-sulfur cluster states of GDGT–MAS from a single [Fe3S4] cluster (A) to the holoenzyme ([Fe4S4]3+Fe, P).* Region 2 displays GDGT–MAS–lipid complexes with a single lipid bound to the enzyme. Each peak represents a GDGT–MAS–lipid complex, wherein the letter identifies the observed iron-sulfur cluster state, and the colored dot indicates which lipid is bound. Similarly, Region 3 displays GDGT–MAS–lipid complexes with two bound lipids. Finally, the inlayed ejection mass spectra show the molecules bound to the enzyme-ligand complex. The observed m/z values from as-isolated GDGT–MAS, a, are consistent with the most prevalent phospholipids in E. coli. Comparably, the observed m/z values from Ma lipid-exchanged GDGT–MAS, b, are consistent with the most prevalent lipids in Ma. Finally, after lipid exchange with the AG substrate (blue dot), c, the full-scan MS of the native protein solely displays mass shifts associated with the binding of one or two AG molecules. Moreover, ejection of the bound lipids yielded a high-resolution mass spectrum containing an m/z value that matches AG. *The various iron-sulfur cluster states observed are presumed to be formed in the mass spectrometer during ionization. We have yet to identify an optimal ionization energy/technique to solely observe the holoenzyme.
Extended Data Fig. 7. Identification and characterization of lipid products formed by GDGT–MAS.
a–c, Time-dependent production of 5′-dAH and lipid products under catalytic conditions. Unless otherwise stated, GDGT–MAS in vitro activity assays were conducted with 2.5 µM GDGT–MAS, 10 µM archaetidylglycerol (AG), 300 µM SAM, 1 mM TiCitrate, 200 mM KCl, and 10 µM D-methionine-methyl-d3 in 75 mM HEPES, pH 7.5. a, Time-dependent formation of 5′-dAH in the presence (red line) and absence (black trace) of AG substrate. The dotted gray line indicates concentration of enzyme in the assay. b, Time-dependent formation of the three unknown lipids denoted lipid I (red trace), lipid II (green trace), and lipid III (blue trace). c, LC-MS extracted-ion chromatogram of the GDGT–MAS reaction showing retention time of AG substrate (black trace) at 9.1 min, lipid I at 8.9 min (red trace), lipid II at 15.2 min (green trace), and lipid III (blue trace) at 16.6 min. d–g, Structural characterization of AG (d), macrocyclic AG (e), GDGT (f), and GTGT (g) by tandem MS/MS with dashed lines representing the fragmented bond. Fragmentation of the ether bond on the AG substrate, shown in panel d, results in a 527.3727 m/z daughter ion, indicating the neutral loss of one phytanyl chain. Novel lipid I and lipid II, shown in panels e and f, respectively, produce similar fragmentation patterns, revealing the presence of a biphytanyl chain (557.6046 m/z daughter ion) that results from cleavage of two ether bonds. This result indicates that both lipid I and lipid II solely contain biphytanyl. g, Tandem MS/MS on novel lipid III produces a fragmentation pattern that indicates the molecule contains both a phytanyl chain and a biphytanyl chain, as evidenced by the m/z 527.3730 and 557.6056 daughter ions, respectively. Therefore, lipid III is GTGT. Error bars represent one standard deviation for reactions conducted in triplicate, with the center representing the mean. *See Supplementary Fig. 6 for complete fragmentation.
Extended Data Fig. 8. Structural and biochemical evidence for an AG–[Fe4S4]C intermediate.
a, Carbon numbering of the phytanyl chain. C16 and C20 are the phytanyl terminal carbons. b, Proposed stoichiometry for the reaction catalyzed by GDGT–MAS, wherein the formation of the biphytanyl chain requires two molecules of SAM. The catalyzed reaction requires storage of a high-energy radical intermediate, which can be achieved by (c) olefin formation or (d) creation of a sulfur-carbon bond. e, GDGT–MAS contains three auxiliary metallocofactors that might play a role in tuning redox potentials and electron transfer. f, Sequence alignment of 1000 archaeal GDGT–MAS homologs indicates that the labile Met439 and Tyr459 are completely conserved. Sequence alignment is visualized in Weblogo format. g, The terminal carbon of the phytanyl chain is 8.0 Å from the [Fe4S4]C, which is a favorable distance for coupling of the substrate radical with the cluster to generate a sulfur-carbon bond intermediate. h, Structural characterization of the sulfur-carbon bond intermediate (sulfur-containing archaetidylglycerol, S-AG) with the structure, chemical formula, and exact mass on the left of the panel. The mass spectrum in the center shows the m/z values observed for S-AG that result from natural abundance isotopes. The product ions resulting from tandem MS/MS fragmentation of S-AG are shown at the right of the panel with dashed lines identifying the location of the fragmented bond and the resulting theoretical m/z. All observed m/z values from tandem MS/MS are displayed on the mass spectrum. In the tandem MS/MS spectra, dashed lines and product ions colored red indicate the presence of a phytanyl chain, while yellow coloring indicates the presence of a sulfur-containing phytanyl chain.
Extended Data Fig. 9. The ¾ TIM barrel loop domain hypothesized to mediate active site opening for SAM, 5′-dAH, and methionine.
Overlay of structures determined by X-ray crystallography (light pink) with AlphaFold predicted model (pale green) highlighting a loop region (Gln268 through Arg285, not transparent) that opens the top of the RS ¾ TIM barrel to solvent. a, view from exterior of protein. b, view from interior of protein. c, Analysis of Fo-Fc omit map contoured to 3.0σ (green mesh) in the GDGT–MAS archaeal lipid complex shows electron density for the AlphaFold predicted loop. Therefore, the X-ray crystal structure has partial occupancy for the open loop. However, the major confirmation within the protein crystal lattice is closed. d, These structures suggest that when Gln268 and Ser271 form H-bonds with the adenosine and ribose moieties of 5′-dAH—and presumably SAM—the loop closes and traps a key molecule of water. This water molecule links N6 of 5′-dAH and the peptide backbone of Arg275 through H-bonding, which positions Arg275 into a H-bonding network with Cys102, Cys105, Asn108, and Ala109 to close the active site from solvent. e, Conformational difference between Gln268, Ser271, and Arg275 in the open (pale green) versus closed (light pink) loop. *Refer to Supplementary Fig. 6 for C-alpha structural alignments.
Similar articles
- Tetraether archaeal lipids promote long-term survival in extreme conditions.
Liman GLS, Garcia AA, Fluke KA, Anderson HR, Davidson SC, Welander PV, Santangelo TJ. Liman GLS, et al. Mol Microbiol. 2024 May;121(5):882-894. doi: 10.1111/mmi.15240. Epub 2024 Feb 19. Mol Microbiol. 2024. PMID: 38372181 - Identification of CDP-archaeol synthase, a missing link of ether lipid biosynthesis in Archaea.
Jain S, Caforio A, Fodran P, Lolkema JS, Minnaard AJ, Driessen AJM. Jain S, et al. Chem Biol. 2014 Oct 23;21(10):1392-1401. doi: 10.1016/j.chembiol.2014.07.022. Epub 2014 Sep 11. Chem Biol. 2014. PMID: 25219966 - GDGT cyclization proteins identify the dominant archaeal sources of tetraether lipids in the ocean.
Zeng Z, Liu XL, Farley KR, Wei JH, Metcalf WW, Summons RE, Welander PV. Zeng Z, et al. Proc Natl Acad Sci U S A. 2019 Nov 5;116(45):22505-22511. doi: 10.1073/pnas.1909306116. Epub 2019 Oct 7. Proc Natl Acad Sci U S A. 2019. PMID: 31591189 Free PMC article. - Archeal Di-O-geranylgeranyl Glyceryl Phosphate Synthase of a UbiA Superfamily Member Provides Insight into the Multiple Human Diseases.
Boral D, Rao VK, Ramasamy S. Boral D, et al. Protein Pept Lett. 2020;27(7):568-573. doi: 10.2174/0929866526666191209143948. Protein Pept Lett. 2020. PMID: 31814543 Review. - A re-evaluation of the archaeal membrane lipid biosynthetic pathway.
Villanueva L, Damsté JS, Schouten S. Villanueva L, et al. Nat Rev Microbiol. 2014 Jun;12(6):438-48. doi: 10.1038/nrmicro3260. Epub 2014 May 7. Nat Rev Microbiol. 2014. PMID: 24801941 Review.
Cited by
- Membrane lipid and expression responses of Saccharolobus islandicus REY15A to acid and cold stress.
Chiu BK, Waldbauer J, Elling FJ, Mete ÖZ, Zhang L, Pearson A, Eggleston EM, Leavitt WD. Chiu BK, et al. Front Microbiol. 2023 Aug 15;14:1219779. doi: 10.3389/fmicb.2023.1219779. eCollection 2023. Front Microbiol. 2023. PMID: 37649629 Free PMC article. - Twenty Years of Radical SAM! The Genesis of the Superfamily.
Booker SJ, Lloyd CT. Booker SJ, et al. ACS Bio Med Chem Au. 2022 Dec 5;2(6):538-547. doi: 10.1021/acsbiomedchemau.2c00078. eCollection 2022 Dec 21. ACS Bio Med Chem Au. 2022. PMID: 37101427 Free PMC article. No abstract available. - Biosynthesis of GMGT lipids by a radical SAM enzyme associated with anaerobic archaea and oxygen-deficient environments.
Li Y, Yu T, Feng X, Zhao B, Chen H, Yang H, Chen X, Zhang XH, Anderson HR, Burns NZ, Zeng F, Tao L, Zeng Z. Li Y, et al. Nat Commun. 2024 Jun 19;15(1):5256. doi: 10.1038/s41467-024-49650-x. Nat Commun. 2024. PMID: 38898040 Free PMC article. - Cluster-selective 57Fe labeling of a Twitch-domain-containing radical SAM enzyme.
Namkoong G, Suess DLM. Namkoong G, et al. Chem Sci. 2023 Jun 2;14(27):7492-7499. doi: 10.1039/d3sc02016a. eCollection 2023 Jul 12. Chem Sci. 2023. PMID: 37449070 Free PMC article. - Expanding the viewpoint: Leveraging sequence information in enzymology.
Knox HL, Allen KN. Knox HL, et al. Curr Opin Chem Biol. 2023 Feb;72:102246. doi: 10.1016/j.cbpa.2022.102246. Epub 2023 Jan 2. Curr Opin Chem Biol. 2023. PMID: 36599282 Free PMC article. Review.
References
- Valentine DL. Adaptations to energy stress dictate the ecology and evolution of the Archaea. Nat. Rev. Microbiol. 2007;5:316–323. - PubMed
- Caforio A, Driessen AJM. Archaeal phospholipids: structural properties and biosynthesis. Biochim. Biophys. Acta Mol. Cell. Biol. Lipids. 2017;1862:1325–1339. - PubMed
MeSH terms
Substances
Grants and funding
- P30 GM124169/GM/NIGMS NIH HHS/United States
- R35 GM119707/GM/NIGMS NIH HHS/United States
- R35 GM122595/GM/NIGMS NIH HHS/United States
- S10 OD012289/OD/NIH HHS/United States
- HHMI/Howard Hughes Medical Institute/United States
LinkOut - more resources
Full Text Sources
Other Literature Sources
Molecular Biology Databases


