Visualization of conformational changes and membrane remodeling leading to genome delivery by viral class-II fusion machinery - PubMed (original) (raw)
Visualization of conformational changes and membrane remodeling leading to genome delivery by viral class-II fusion machinery
Vidya Mangala Prasad et al. Nat Commun. 2022.
Abstract
Chikungunya virus (CHIKV) is a human pathogen that delivers its genome to the host cell cytoplasm through endocytic low pH-activated membrane fusion mediated by class-II fusion proteins. Though structures of prefusion, icosahedral CHIKV are available, structural characterization of virion interaction with membranes has been limited. Here, we have used cryo-electron tomography to visualize CHIKV's complete membrane fusion pathway, identifying key intermediary glycoprotein conformations coupled to membrane remodeling events. Using sub-tomogram averaging, we elucidate features of the low pH-exposed virion, nucleocapsid and full-length E1-glycoprotein's post-fusion structure. Contrary to class-I fusion systems, CHIKV achieves membrane apposition by protrusion of extended E1-glycoprotein homotrimers into the target membrane. The fusion process also features a large hemifusion diaphragm that transitions to a wide pore for intact nucleocapsid delivery. Our analyses provide comprehensive ultrastructural insights into the class-II virus fusion system function and direct mechanistic characterization of the fundamental process of protein-mediated membrane fusion.
© 2022. The Author(s).
Conflict of interest statement
The authors declare no competing interests.
Figures
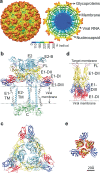
Fig. 1. Structure of CHIKV particle.
a Surface view (left) and cross-sectional view (right) of UV-inactivated CHIKV strain S27. Cryo-EM density map is colored according to radius. b Side view of ribbon structure of the trimeric surface glycoprotein heterodimers in contact with the inner capsid protein as observed in the wild-type virion (PDB ID: 3J2W). c Top view of the trimeric E1-E2 heterodimers on wild-type CHIKV. d, e Side and top view of the crystallographic structure of post-fusion E1 homotrimers (PDB ID: 1RER) respectively. In all panels, E1 is colored according to domains (domain I: red, domain II: yellow, domain III: blue, FL: magenta, E1-transmembrane domain: gray), E2 is in light blue and capsid protein in green.
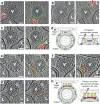
Fig. 2. CHIKV membrane recruitment – stage I.
a–c Left panel: Tomogram slice showing CHIKV (V) interacting with liposome (L) via thin, delicate attachments. Right: Same tomogram slice as in the left panel but annotated to show the different protein and membrane layers: CHIKV glycoprotein layer in orange, CHIKV membrane in teal and liposome membrane in green. The attachments between CHIKV and liposome membrane are denoted by red arrowheads. d Cartoon representation of this fusion stage. Created with Biorender.com. e Tomogram slices showing examples of singular, long glycoprotein connection (red bracket with arrowhead) to liposome membrane. Leftmost panel alone is annotated similar to previous panels for reference. Scale bar is 200 Å in all panels. Black is high density in all panels.
Fig. 3. Glycoprotein membrane attachment and E1 homotrimer formation (stages II and III).
a–c Stage II. Left panels: Tomogram slice showing long bridge-like attachments between CHIKV (V) and liposomes (L). Red arrowhead indicates extended glycoprotein density and orange arrowhead denotes remaining glycoprotein density close to the viral membrane surface. Right: Same tomogram slice as in the left panels but annotated to show the different protein and membrane layers. CHIKV glycoprotein layer in orange, CHIKV membrane in teal and liposome membrane in green. Glycoprotein attachments between CHIKV and liposome membrane are denoted by red arrowheads. d Cartoon representation of this fusion stage with zoomed inset showing the virus-target membrane interaction interface. Created with Biorender.com. e–g Stage III. Similar representation as in (a–c) with left panels showing the raw tomogram slices and right panels showing the same slices with annotation. Cone-like glycoprotein densities that resemble E1-HTs are colored in orange. h Cartoon representation of the E1-homotrimer formation stage with zoomed inset highlighting the region of interest. Created with Biorender.com. Scale bar is 200 Å and black is high density in all panels.
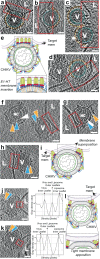
Fig. 4. E1-HT membrane insertion and opposing membrane superposition (stages IV-VI).
a–d Annotated tomogram slices showing insertion of protein densities into the liposome (L) causing disruption of membrane density at the interface. CHIKV (V) are annotated similar to previous figures with red dotted rectangles enclosing interaction areas of interest. e Cartoon representation of fusion stage IV – E1-HT membrane insertion. Created with Biorender.com. f–h Tomogram slices showing superposition of the viral and liposome membranes. Interaction interfaces are enclosed in red rectangles. Variation and fluidity in the glycoprotein layer (orange triangles) can be seen in f, g. White triangles represent the gap observed between the NC and inner surface of the viral membrane (blue triangles). i Cartoon representation of fusion stage V—membrane superposition, with dotted rectangle outlining the interface. Created with Biorender.com. j, k Tomogram slices howing tightly docked membrane interfaces with the proximal leaflets too close to separate at the current tomogram resolution. Corresponding electron density plots along a line traversing the tight-membrane interface in the boxed region (red) of the tomogram slices are also shown. l. Cartoon representation of the tightly docked membrane interface (stage VI) with zoomed inset showing region of interest. Created with Biorender.com. Scale bar is 200 Å and black is high density in all panels.
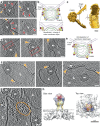
Fig. 5. Membrane fusion stages VII -IX – hemifusion to nucleocapsid release.
a Tomogram slices showing clear examples of hemifusion or mixing of membrane leaflets between CHIKV (V) and liposomes (L). Red arrows indicate three-way junctions where the two membranes intersect. Orange arrows indicate glycoprotein density (also colored in orange) at the hemifusion junction that correspond to post-fusion E1 homotrimers. Black arrow shows presence of E1 homotrimers on virion membrane, suggesting that E1-FL can bind to viral membrane itself on availability. b Cartoon representation of hemifusion with zoomed inset showing the region of mixing between the two outer leaflets. Created with Biorender.com. c Surface 3D rendering of hemifused virion shown in bottom left of (a). Side view (left) and 90° rotated view (right) is shown. The circular surface of hemifusion diaphragm can be seen (black dotted circle). d Disintegration of the mixed central layer in the hemifused state leads to formation of a fusion pore. Fusion pore interface is shown as red rectangles and glycoproteins indicated as orange triangles. e Cartoon representation of d. Created with Biorender.com. f Subsequent release of the CHIKV nucleocapsid (NC) into the liposome lumen after fusion of the viral and liposome membranes. Floating glycoprotein densities on liposome surface are indicated in orange. g Top view of a fused CHIKV showing triangle-shaped glycoprotein densities (orange oval) on the liposome surface. h Sub-tomogram average of the glycoprotein densities seen in f, g, with the post-fusion E1-homotrimer crystal structure (PDB ID: 1RER) fitted into the density. Scale bar is 200 Å and black is high density in a–g.
Fig. 6. CHIKV membrane fusion pathway.
a Population of fusion-states during CHIKV membrane fusion. For pH 5.6 (left) and pH 5.1 (right), percentage of each fusion-state was calculated as a function of the total number of CHIKV-liposome contacts (n) observed at that given pH and timepoint. For pH 5.6, n = 281 and for pH 5.1, n = 263. E1 attachment (red plot line) includes stages I (membrane recruitment) and II (membrane attachment); E1-HT/Membrane Insertion (gray plot line) includes stage III-VI: E1-HT formation, E1-HT membrane insertion, membrane superposition and tight apposition; Hemifusion (yellow plot line) includes stages VII (Hemifusion) and VIII (fusion pore formation); Post-fusion NC release (blue plot line) includes stage IX (nucleocapsids released into liposomal lumen). Error bars have been calculated as square root of the number of complexes observed for each fusion state at the given pH and timepoint, similar to previous report. b Cartoon schematic of CHIKV membrane fusion stages. Created with Biorender.com. Source data are provided as a Source Data file.
Similar articles
- Visualizing intermediate stages of viral membrane fusion by cryo-electron tomography.
Kephart SM, Hom N, Lee KK. Kephart SM, et al. Trends Biochem Sci. 2024 Oct;49(10):916-931. doi: 10.1016/j.tibs.2024.06.012. Epub 2024 Jul 24. Trends Biochem Sci. 2024. PMID: 39054240 Review. - Anti-Chikungunya Virus Monoclonal Antibody That Inhibits Viral Fusion and Release.
Tumkosit U, Siripanyaphinyo U, Takeda N, Tsuji M, Maeda Y, Ruchusatsawat K, Shioda T, Mizushima H, Chetanachan P, Wongjaroen P, Matsuura Y, Tatsumi M, Tanaka A. Tumkosit U, et al. J Virol. 2020 Sep 15;94(19):e00252-20. doi: 10.1128/JVI.00252-20. Print 2020 Sep 15. J Virol. 2020. PMID: 32699087 Free PMC article. - The Fusion Loops of the Initial Prefusion Conformation of Herpes Simplex Virus 1 Fusion Protein Point Toward the Membrane.
Fontana J, Atanasiu D, Saw WT, Gallagher JR, Cox RG, Whitbeck JC, Brown LM, Eisenberg RJ, Cohen GH. Fontana J, et al. mBio. 2017 Aug 22;8(4):e01268-17. doi: 10.1128/mBio.01268-17. mBio. 2017. PMID: 28830949 Free PMC article. - Influenza virus-mediated membrane fusion: Structural insights from electron microscopy.
Fontana J, Steven AC. Fontana J, et al. Arch Biochem Biophys. 2015 Sep 1;581:86-97. doi: 10.1016/j.abb.2015.04.011. Epub 2015 May 6. Arch Biochem Biophys. 2015. PMID: 25958107 Free PMC article. Review.
Cited by
- Unleashing virus structural biology: Probing protein and membrane intermediates in the dynamic process of membrane fusion.
Lee KK. Lee KK. QRB Discov. 2025 Mar 31;6:e14. doi: 10.1017/qrd.2025.3. eCollection 2025. QRB Discov. 2025. PMID: 40371173 Free PMC article. Review. - Unveiling the structural spectrum of SARS-CoV-2 fusion by in situ cryo-ET.
Akıl C, Xu J, Shen J, Zhang P. Akıl C, et al. Nat Commun. 2025 Jun 3;16(1):5150. doi: 10.1038/s41467-025-60406-z. Nat Commun. 2025. PMID: 40461447 Free PMC article. - Zika virus M protein latches and locks the E protein from transitioning to an immature state after prM cleavage.
Majowicz SA, Narayanan A, Moustafa IM, Bator CM, Hafenstein SL, Jose J. Majowicz SA, et al. Npj Viruses. 2023 Nov 6;1(1):4. doi: 10.1038/s44298-023-00004-2. Npj Viruses. 2023. PMID: 40295858 Free PMC article. - Visualizing intermediate stages of viral membrane fusion by cryo-electron tomography.
Kephart SM, Hom N, Lee KK. Kephart SM, et al. Trends Biochem Sci. 2024 Oct;49(10):916-931. doi: 10.1016/j.tibs.2024.06.012. Epub 2024 Jul 24. Trends Biochem Sci. 2024. PMID: 39054240 Review. - The evolutionary and molecular history of a chikungunya virus outbreak lineage.
Krambrich J, Mihalič F, Gaunt MW, Bohlin J, Hesson JC, Lundkvist Å, de Lamballerie X, Li C, Shi W, Pettersson JH. Krambrich J, et al. PLoS Negl Trop Dis. 2024 Jul 26;18(7):e0012349. doi: 10.1371/journal.pntd.0012349. eCollection 2024 Jul. PLoS Negl Trop Dis. 2024. PMID: 39058744 Free PMC article.
References
- R.J., K. 629-650 (Lippincott, Williams, and Wilkins, Philadelphia, Pennsylvania, USA, 2013).
Publication types
MeSH terms
Substances
LinkOut - more resources
Full Text Sources
Medical


