Longitudinal analysis of sentiment and emotion in news media headlines using automated labelling with Transformer language models - PubMed (original) (raw)
Longitudinal analysis of sentiment and emotion in news media headlines using automated labelling with Transformer language models
David Rozado et al. PLoS One. 2022.
Abstract
This work describes a chronological (2000-2019) analysis of sentiment and emotion in 23 million headlines from 47 news media outlets popular in the United States. We use Transformer language models fine-tuned for detection of sentiment (positive, negative) and Ekman's six basic emotions (anger, disgust, fear, joy, sadness, surprise) plus neutral to automatically label the headlines. Results show an increase of sentiment negativity in headlines across written news media since the year 2000. Headlines from right-leaning news media have been, on average, consistently more negative than headlines from left-leaning outlets over the entire studied time period. The chronological analysis of headlines emotionality shows a growing proportion of headlines denoting anger, fear, disgust and sadness and a decrease in the prevalence of emotionally neutral headlines across the studied outlets over the 2000-2019 interval. The prevalence of headlines denoting anger appears to be higher, on average, in right-leaning news outlets than in left-leaning news media.
Conflict of interest statement
The authors have declared that no competing interests exist.
Figures
Fig 1. The solid blue line shows the average yearly sentiment of headlines across 47 popular news media outlets.
The shaded area indicates the 95% confidence interval around the mean. A statistical test for the null hypothesis of zero slope is shown on the bottom left of the plot. The percentage change on average yearly sentiment across outlets between 2000 and 2019 is shown on the top left of the plot.
Fig 2. Average yearly sentiment of headlines grouped by the ideological leanings of news outlets using human ratings of outlets political bias from the 2019 AllSides Media Bias Chart v1.1 [24].
The figure displays the standard error bars of the average yearly sentiment for outlets within each color-coded political orientation category. For each ideological grouping, statistical tests for the null hypothesis of zero slope are shown on the bottom left of the plot.
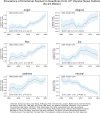
Fig 3. Average yearly prevalence of news articles headlines denoting different types of emotionality in 47 popular news media outlets.
The shaded gray area indicates the 95% confidence interval around the mean. Note the different scale of the Y axes for the different emotion types. For each emotional category, statistical tests for the null hypothesis of zero slope are shown on the bottom left of each subplot. Reported p-values have been Bonferroni-corrected for multiple comparisons. The percentage changes between 2000 and 2019 are shown on the top left of each subplot.
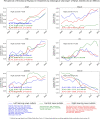
Fig 4. Yearly prevalence of headlines denoting different types of emotionality in 47 popular news outlets grouped by human ratings of news media ideological leanings from the 2019 AllSides Media Bias Chart v1.1 [24].
Note the different scale of the Y axes for the different emotion types. Only statistical tests within each ideological grouping for which the null hypothesis of zero slope was rejected (after Bonferroni correction for multiple comparisons) are shown on the bottom left of each plot.
Similar articles
- Beyond fear and anger: A global analysis of emotional response to Covid-19 news on Twitter using deep learning.
Oliveira FB, Mougouei D, Haque A, Sichman JS, Dam HK, Evans S, Ghose A, Singh MP. Oliveira FB, et al. Online Soc Netw Media. 2023 Jun 14:100253. doi: 10.1016/j.osnem.2023.100253. Online ahead of print. Online Soc Netw Media. 2023. PMID: 37360968 Free PMC article. - Determination of Patient Sentiment and Emotion in Ophthalmology: Infoveillance Tutorial on Web-Based Health Forum Discussions.
Nguyen AX, Trinh XV, Wang SY, Wu AY. Nguyen AX, et al. J Med Internet Res. 2021 May 17;23(5):e20803. doi: 10.2196/20803. J Med Internet Res. 2021. PMID: 33999001 Free PMC article. - Social Media News Headlines and Their Influence on Well-Being: Emotional States, Emotion Regulation, and Resilience.
Mousoulidou M, Taxitari L, Christodoulou A. Mousoulidou M, et al. Eur J Investig Health Psychol Educ. 2024 Jun 5;14(6):1647-1665. doi: 10.3390/ejihpe14060109. Eur J Investig Health Psychol Educ. 2024. PMID: 38921075 Free PMC article. - Obesity in the news: directions for future research.
Atanasova D, Koteyko N, Gunter B. Atanasova D, et al. Obes Rev. 2012 Jun;13(6):554-9. doi: 10.1111/j.1467-789X.2012.00985.x. Epub 2012 Feb 17. Obes Rev. 2012. PMID: 22340286 Review. - Evaluating the Media as a source of Drug Therapy Information.
[No authors listed] [No authors listed] 2007 Dec. Perry T, editor. Therapeutics Letter. Vancouver (BC): Therapeutics Initiative; 1994–. Letter 67. 2007 Dec. Perry T, editor. Therapeutics Letter. Vancouver (BC): Therapeutics Initiative; 1994–. Letter 67. PMID: 38620426 Free Books & Documents. Review.
Cited by
- High risk of political bias in black box emotion inference models.
Plisiecki H, Lenartowicz P, Flakus M, Pokropek A. Plisiecki H, et al. Sci Rep. 2025 Feb 19;15(1):6028. doi: 10.1038/s41598-025-86766-6. Sci Rep. 2025. PMID: 39972000 Free PMC article. - Negative online news articles are shared more to social media.
Watson J, van der Linden S, Watson M, Stillwell D. Watson J, et al. Sci Rep. 2024 Sep 16;14(1):21592. doi: 10.1038/s41598-024-71263-z. Sci Rep. 2024. PMID: 39285221 Free PMC article. - Analysis of the hikikomori phenomenon - an international infodemiology study of Twitter data in Portuguese.
Correia Lopes F, Pinto da Costa M, Fernandez-Lazaro CI, Lara-Abelenda FJ, Pereira-Sanchez V, Teo AR, Alvarez-Mon MA. Correia Lopes F, et al. BMC Public Health. 2024 Feb 19;24(1):518. doi: 10.1186/s12889-023-17617-0. BMC Public Health. 2024. PMID: 38373925 Free PMC article. - News source bias and sentiment on social media.
Knutson B, Hsu TW, Ko M, Tsai JL. Knutson B, et al. PLoS One. 2024 Oct 23;19(10):e0305148. doi: 10.1371/journal.pone.0305148. eCollection 2024. PLoS One. 2024. PMID: 39441772 Free PMC article. - Regional insights on tobacco-related tweets: unveiling user opinions and usage patterns.
Castillo-Toledo C, Fernandez-Lazaro CI, Lara-Abelenda FJ, Molina-Ruiz RM, Ortega MA, Mora F, Alvarez-Mon M, Quintero J, Alvarez-Mon MA. Castillo-Toledo C, et al. Front Public Health. 2024 Jun 14;12:1342460. doi: 10.3389/fpubh.2024.1342460. eCollection 2024. Front Public Health. 2024. PMID: 38947344 Free PMC article.
References
- O’Brien H. L., “Exploring user engagement in online news interactions,” Proceedings of the American Society for Information Science and Technology, vol. 48, no. 1, pp. 1–10, 2011, 10.1002/meet.2011.14504801088. - DOI
- Bransford J. D. and Johnson M. K., “Contextual prerequisites for understanding: Some investigations of comprehension and recall,” Journal of Verbal Learning and Verbal Behavior, vol. 11, no. 6, pp. 717–726, Dec. 1972, doi: 10.1016/S0022-5371(72)80006-9 - DOI
- Hasell A., “Shared Emotion: The Social Amplification of Partisan News on Twitter,” Digital Journalism, vol. 9, no. 8, pp. 1085–1102, Sep. 2021, doi: 10.1080/21670811.2020.1831937 - DOI
- Berger J. and Milkman K. L., “What Makes Online Content Viral?,” Journal of Marketing Research, vol. 49, no. 2, pp. 192–205, Apr. 2012, doi: 10.1509/jmr.10.0353 - DOI
MeSH terms
LinkOut - more resources
Full Text Sources


