Actin cytoskeleton and complex cell architecture in an Asgard archaeon - PubMed (original) (raw)
Actin cytoskeleton and complex cell architecture in an Asgard archaeon
Thiago Rodrigues-Oliveira et al. Nature. 2023 Jan.
Abstract
Asgard archaea are considered to be the closest known relatives of eukaryotes. Their genomes contain hundreds of eukaryotic signature proteins (ESPs), which inspired hypotheses on the evolution of the eukaryotic cell1-3. A role of ESPs in the formation of an elaborate cytoskeleton and complex cellular structures has been postulated4-6, but never visualized. Here we describe a highly enriched culture of 'Candidatus Lokiarchaeum ossiferum', a member of the Asgard phylum, which thrives anaerobically at 20 °C on organic carbon sources. It divides every 7-14 days, reaches cell densities of up to 5 × 10⁷ cells per ml and has a significantly larger genome compared with the single previously cultivated Asgard strain7. ESPs represent 5% of its protein-coding genes, including four actin homologues. We imaged the enrichment culture using cryo-electron tomography, identifying 'Ca. L. ossiferum' cells on the basis of characteristic expansion segments of their ribosomes. Cells exhibited coccoid cell bodies and a network of branched protrusions with frequent constrictions. The cell envelope consists of a single membrane and complex surface structures. A long-range cytoskeleton extends throughout the cell bodies, protrusions and constrictions. The twisted double-stranded architecture of the filaments is consistent with F-actin. Immunostaining indicates that the filaments comprise Lokiactin-one of the most highly conserved ESPs in Asgard archaea. We propose that a complex actin-based cytoskeleton predated the emergence of the first eukaryotes and was a crucial feature in the evolution of the Asgard phylum by scaffolding elaborate cellular structures.
© 2022. The Author(s).
Conflict of interest statement
The authors declare no competing interests.
Figures
Fig. 1. Enrichment and cultures of Loki-B35.
a, Schematic of our cultivation approach. A sediment core fraction was used as an inoculum for cultivation in sterile-filtered environmental water from the sampling site supplemented with complex organic compounds. The enrichment was then transferred to modified MK-D1 medium. Enrichments of up to 79% were obtained when the cultures were transferred to MLM supplemented with casein hydrolysate. AB, antibiotics. The figure was created using BioRender. b, The composition of the culture with the highest enrichment as assessed by 16S rRNA gene amplicon sequencing. c, Growth curves (n = 4) of Loki-B35 in MLM (80:20 N2:CO2) supplemented with casein hydrolysate (growth was quantified by qPCR), indicating maximum cell densities of 2.5 × 10⁷ per ml and generation times of about 7–14 days.
Fig. 2. Genome analysis and phylogenetic placement of ‘Ca. L. ossiferum’.
On the basis of the analysis of the closed genome of enrichment Loki-B35, we propose a description of the species ‘Ca. L. ossiferum’. a, The characteristics of the genome of ‘Ca. L. ossiferum’ in comparison to ‘Ca. P. syntrophicum’. Note the substantial difference in genome size. The values indicated by asterisks are the estimated values of contamination and completeness on the basis of the identification of marker genes performed by CheckM (Methods). b, The diagram shows to scale the number of shared clusters of orthologous proteins between ‘Ca. L. ossiferum’ and ‘Ca. P. syntrophicum’ as well as genome-specific clusters. A more detailed analysis is provided in Extended Data Fig. 4. c, A comparison of the occurrence of ESPs in ‘Ca. L. ossiferum’ and ‘Ca. P. syntrophicum’. Annotation of ESPs was performed according to the asCOG database; general functional categories (on top) were added similar to earlier assignments. Note that ‘Ca. L. ossiferum’ is enriched for ESPs of the following protein families associated with trafficking machineries: adaptin N heat repeats domain; Arf-like GTPase; Gtr1/RagA GTPase; longin domain; NPRL2-like longin domain. d,e, Maximum-likelihood (ML) phylogenies based on the concatenation of 23 universally conserved ribosomal proteins. d, Tree of life showing Eukarya as a sister clade of Asgardarchaeota. e, ‘Ca. L. ossiferum’ and ‘Ca. P. syntrophicum’ belong to the same Lokiarchaeia class. Taxonomic assignments are based on the recently proposed classification. Branch supports were calculated with 1,000 ultrafast bootstrap samples. The values in square brackets show the genome sizes of complete genomes (bold) and MAGs within Lokiarchaeia.
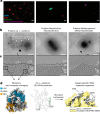
Fig. 3. Identification of ‘Ca. L. ossiferum’ cells in the enrichment culture.
a, Hybridization chain reaction-FISH analysis of the enrichment culture stained with DAPI (cyan) and nucleotide probes targeting the major species of the culture, that is, Lokiarchaea cells (red; the sample on the left was 70× concentrated), bacteria (green) and Methanomicrobiales (purple). The FISH experiments were performed five independent times with similar results. Scale bars, 2 µm. b, Low-magnification 2D cryo-electron micrographs of the three major cell types that were observed after screening of the enrichment culture (n = 2 independent cultures), showing a putative ‘Ca. L. ossiferum’ cell with a round cell body and complex cell protrusions (left), a Gram-negative bacterial cell (middle) and an archaeal cell (right). Scale bars, 1 µm. c, Slices through cryo-tomograms of all three organisms shown in c (slice thickness, 9.02 nm), detailing the characteristic cell envelope architecture of the three species. Putative Lokiarchaea show small and unordered surface densities (sda) and complex surface proteins (sdb) protruding from a single membrane. cm, cytoplasmic membrane; cp, cytoplasm; om, outer membrane; pp, periplasm; sl, surface layer. Scale bars, 100 nm. d, Identification of ‘Ca. L. ossiferum’ by Asgard-specific rRNA structures. Left, a sub-tomogram average (11.7 Å resolution) of ribosomes from cryo-tomograms of putative lokiarchaeal cells (large-subunit proteins (LSU), blue; small-subunit proteins (SSU), orange; rRNA, white). Middle, secondary structure prediction of the ‘Ca. L. ossiferum’ large-subunit rRNA (expansion segments ES9/ES39 are labelled). Right, a superposition of the average with a low-pass filtered (11 Å) map of the T. kodakarensis 70S ribosome (Protein Data Bank (PDB):
6SKF
; yellow). The ‘Ca. L. ossiferum’ structure (white) shows prominent additional rRNA features that were identified as the Asgard-specific rRNA expansion segments ES9 and ES39. See also Extended Data Fig. 6.
Fig. 4. Complex and variable architecture of ‘Ca. L. ossiferum’ cells.
a,b, SEM imaging of fixed ‘Ca. L. ossiferum’ cells showed small coccoid cells with extensive protrusions. Example micrographs from n = 2 independent cultures are shown. See also Extended Data Fig. 7d. For a and b, scale bars, 500 nm. c–f, Slices through cryo-tomograms (c,e; thickness, 9.02 nm) and the corresponding neural-network-aided 3D volume segmentations (d,f) of two different ‘Ca. L. ossiferum’ cells. The insets in c and e show 2D overview images of the two different target cells. Cell bodies (c,d) and networks of protrusions (e,f) both contained ribosomes (grey arrowheads), cytoskeletal filaments (orange arrowheads) and complex surface densities (blue arrowheads). Note that e and f show the same cell as in Fig. 3c. For c and e, scale bars, 100 nm (tomogram) and 1 µm (2D overview). g,h, Expanded views of slices from tomograms in c and e, showing ribosome chains, complex surface proteins and filaments (colour code as in c–f) in a junction of a cell bridge (g) and a constricted part of the protrusion network (h). For g and h, scale bars, 100 nm. i–l, Slices through cryo-tomograms showing a putative chemoreceptor array (i; indicated by a white arrowhead) and different types of connections between cell bodies and protrusions (j–l). The coloured arrowheads indicate filaments and surface structures as defined for c–f. The white arrowheads in j indicate weak densities at the neck of the junction. Slice thickness, 9.02 nm (j) or 10.71 nm (i and k–l). For i–l, scale bars, 100 nm.
Fig. 5. Lokiactin is involved in cytoskeleton formation.
a, Slice through a cryo-tomogram showing a cytoskeletal filament inside a protrusion at higher magnification. Slice thickness, 5.36 nm. Scale bar, 100 nm. b, Filament segments were extracted from cryo-tomograms for structural analysis. 2D classes that were obtained after helical reconstruction of 2D-projected filament particles are shown, indicating a twisted double-stranded architecture. Box size, 34.3 × 34.3 nm. See also Extended Data Fig. 9. c, Sub-tomogram average (24.5 Å resolution) of the cytoskeletal filament displaying helical parameters with a high similarity to eukaryotic F-actin and archaeal Crenactin. Structural docking shows that an F-actin-like filament is consistent with the reconstructed map. See also Extended Data Fig. 9. Scale bar, 50 Å. d, Maximum-likelihood phylogenetic tree of actin family proteins. The ‘Ca. L. ossiferum’ genome encodes four homologues. One homologue (GenBank:
UYP47028.1
) clusters together with other Asgard archaeal Lokiactins (group indicated by orange arrowhead), which form a sister group to eukaryotic actin. The three other homologues (from top to bottom: GenBank
UYP47647.1
,
UYP44711.1
and
UYP44126.1
) cluster with other Asgard archaeal and eukaryotic ARPs (groups indicated by the black arrowheads). The tree was rooted with the MreB protein family. CR 4, subgroup from within Lokiarchaeia. e,f, Lokiactin is expressed in the enrichment culture. e, Transcription of the four actin homologues was analysed using RT–qPCR analysis of two enrichment cultures, indicating the highest levels of transcripts for Lokiactin. The mean expression levels normalized to Lokiactin are shown. The error bars indicate the s.d. of three technical replicates. f, Expression was also detected using western blotting analysis of a cell lysate obtained from the enrichment culture (representative result from n = 2 independent samples). Gel source data are provided in Supplementary Fig. 1. Two antibodies (ab.) were used that were raised against different ‘Ca. L. ossiferum’ Lokiactin-specific peptides. g,h, Immunofluorescence staining of ‘Ca. L. ossiferum’ cells with two different Lokiactin-specific antibodies analysed using Airyscan (g) or stimulated emission depletion (STED) (h) imaging (representative images of n = 3 (g) or n = 2 (h) independent preparations). The distribution of fluorescent signal indicates the presence of Lokiactin-based cytoskeletal structures in cell bodies and protrusions, being consistent with observations from cryo-tomograms. The top row of g shows single slices of the fluorescent DNA signal (blue, Hoechst stain, LSM-Plus-processed confocal) and the Alexa Fluor 647-labelled secondary antibodies (red/orange, jDCV-processed Airyscan). The bottom row of g shows the minimum intensity _z_-projections of the transmitted light channel to indicate the cell shape. The control (right column) was probed with only secondary antibodies (the contrast in the top row was adjusted equally). The images in h show single slices of representative deconvolved STED images detecting Lokiactin (red/orange, abberior STAR 580-labelled secondary antibodies) and DNA (blue, SPY505-DNA). For g and h, scale bars, 1 µm.
Extended Data Fig. 1. Microbial diversity profile of environmental samples (different brackish sediment core depths) and selected L. ossiferum enrichments.
Diversity estimations were made by amplicon sequencing using general prokaryotic 16S rRNA gene targeting primers (515f-806r). Taxonomic assignment was performed according to the SILVA database. Throughout the enrichment process, the community became more homogeneous, leading to higher lokiarchaeal relative abundances.
Extended Data Fig. 2. Lokiarchaea distribution at different depths in a brackish sediment core sampled in Piran, Slovenia.
Abundance was estimated by submitting DNA extracted from different depths to qPCR assays using primers targeting lokiarchaeal 16S rRNA genes. Criteria for selecting good candidate fractions for enrichments were the number of copies in relation to DNA content. The sample with the highest lokiarchaeal 16S rRNA gene copies/g ratio to DNA content was the 13–16 cm fraction, which was then selected as inoculum for cultivation.
Extended Data Fig. 3. Specificity of qPCR primers LkF and LkR to Asgard archaea 16S rRNA genes.
Amplicons were generated from environmental DNA and submitted to Illumina Miseq (300 PE) sequencing. SILVA was used for taxonomic classification. These analyses show that the LkF and LkR primers designed in this study are highly specific to Asgard archaea 16S rRNA genes.
Extended Data Fig. 4. Functional annotation of groups of orthologous proteins encoded in L. ossiferum and ‘Ca. P. syntrophicum’ genomes.
The venn diagram shows to scale the number of shared clusters of orthologous proteins between L. ossiferum and ‘Ca. P. syntrophicum’ as well as genome-specific clusters. Numbers in parentheses indicate the number of clusters with no functional annotation. The graph shows that L. ossiferum is enriched in almost all categories compared to ‘Ca. P. syntrophicum’, as expected for the larger genome size (>1.6 Mb difference). Functional categories: J, translation, ribosomal structure and biogenesis; K, transcription; L, replication, recombination and repair; D, cell cycle control, cell division and chromosome partitioning; V, defence mechanisms; T, signal transduction mechanisms; M, biogenesis of the cell wall, membrane or envelope; N, cell motility; U, intracellular trafficking, secretion and vesicular transport; O, posttranslational modification, protein turnover and chaperones; X, mobilome; C, energy production and conversion; G, carbohydrate transport and metabolism; E, amino acid transport and metabolism; F, nucleotide transport and metabolism; H, coenzyme transport and metabolism; I, lipid transport and metabolism; P, inorganic ion transport and metabolism; Q, secondary metabolites biosynthesis, transport and catabolism. For visualization purposes, clusters of orthologous proteins assigned to R (general function prediction only) and S (function unknown) categories are not shown. The numbers of clusters with only R and/or S assignment are: only in L. ossiferum, 405; shared, 617; only in ‘Ca. P. syntrophicum’, 384.
Extended Data Fig. 5. Ideogram representation of syntenic regions (grey) between the genomes of L. ossiferum and ‘Ca. P. syntrophicum’.
Note that the genomes are represented in equal sizes (yellow and blue bars), although L. ossiferum has a 1.6 Mb larger genome.
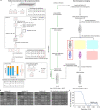
Extended Data Fig. 6. Sub-tomogram averaging of the ribosome and identification of rRNA expansion segments.
a. Flowchart for the sub-tomogram averaging strategy of the ribosome. For details see Methods. b. Gold-standard FSC curve of the sub-tomogram average. c. Scheme of the ribosome identification workflow. For details see Fig. 3 and Methods. d. Multiple sequence alignment of expansion segments (ESs) 9 and 39 of the LSU rRNA of L. ossiferum compared to sequences from T. kodakarensis and those present in the MAGs of the organisms in the enrichment culture (Desulfovibrio_bin1: 44 contigs, 100% complete, 0% contamination; Methanogenium_bin1: 56 contigs, 98.7% complete, 2.6 % contamination; Methanogenium_bin2: 37 contigs, 98.7% complete, 1.9% contamination). The alignment reveals that ESs are only present in L. ossiferum.
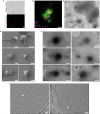
Extended Data Fig. 7. Potential cell-cell interactions, variability of cell shape and rare vesicles observed in cryo-tomograms.
a. FISH analysis of the enrichment cultures with DAPI (cyan) and nucleotide probes targeting Lokiarchaea (red) and bacteria (green) and the corresponding phase contrast image showing isolated L. ossiferum cells. The FISH experiments were performed five independent times, with similar results. Bar: 2 µm. b/c. Aggregates of cells were infrequently observed during imaging of the enrichment culture. FISH analysis (b) with DAPI (cyan) and nucleotide probes targeting Lokiarchaea (red), bacteria (green) and Methanomicrobiales (purple) shows potential interactions of cells from different species. A low-magnification 2D EM image (c) shows L. ossiferum cells (Lo) next to a bacterial cell (B). Since the core of the cell assembly exceeded the thickness limitation of cryoET, no cryo-tomograms could be collected. Bars: 2 µm (b), 1 µm (c). d/e. Representative SEM (d) or low-magnification cryo-TEM images (e) showing different morphologies of L. ossiferum cells (n = 2 independent cultures). Both datasets revealed individual cell bodies that were always connected to at least one longer protrusion or vesicular structure. White arrowheads indicate the position of intracytoplasmic vesicles shown in f. Bars: 500 nm (d), 1 µm (e). f. Slices of cryo-tomograms (slice thickness 21.42 nm) showing the two intracytoplasmic vesicles observed in L. ossiferum protrusions (left) or a cell body (right), indicated by white arrowheads. Both vesicles seem fully enclosed by a membrane and show a low-density lumen. Bars: 100 nm.
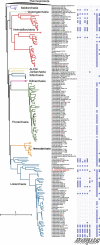
Extended Data Fig. 8. Presence/absence pattern of chemotaxis-related proteins in Asgardarchaeota genomes.
The chemotaxis-related proteins encoded in L. ossiferum (Supplementary Table 4) together with the chemotaxis protein CheV MBN1502358.1 and the chemotaxis accessory protein CheZ CK5345549.1 were used as queries in BLASTp searches (evalue: 1e−10) against our Asgardarchaeota protein database followed by the annotation of putative chemotaxis proteins using BlastKOALA. The presence/absence of proteins were mapped to the expanded phylogenetic tree shown in Fig. 2e. L. ossiferum is highlighted in red.
Extended Data Fig. 9. Analysis of cytoskeletal filaments by helical reconstruction of 2D-projected particles and sub-tomogram averaging.
a. Flowchart of the in situ reconstruction of the cytoskeletal filament. For details see Methods. b. 2D classification of 2D-projected particles after different iterations of the reconstruction workflow and 2D classes obtained after the last iteration without sampling. c. Gold-standard FSC curve of the reconstruction after sub-tomogram averaging.
Extended Data Fig. 10. Immunogold localization of Lokiactin in L. ossiferum.
a. Conventional TEM micrograph of a L. ossiferum cell with no anti-Lokiactin antibodies used. Experiments were performed with samples derived from n = 2 independent cultures, with similar results. Bar: 500 nm. b. Micrographs of different L. ossiferum cells immunogold labelled with a specific anti-Lokiactin primary antibody (ab1, see Methods). Orange arrowheads point out gold beads. Experiments were performed three independent times, with similar results (n = 3). Bars: 500 nm. See also Supplementary Table 10.
Comment in
- Mysterious Asgard archaea microbes reveal their inner secrets.
Löwe J. Löwe J. Nature. 2023 Jan;613(7943):246-248. doi: 10.1038/d41586-022-04450-5. Nature. 2023. PMID: 36544005 No abstract available.
Similar articles
- Depressing time: Waiting, melancholia, and the psychoanalytic practice of care.
Salisbury L, Baraitser L. Salisbury L, et al. In: Kirtsoglou E, Simpson B, editors. The Time of Anthropology: Studies of Contemporary Chronopolitics. Abingdon: Routledge; 2020. Chapter 5. In: Kirtsoglou E, Simpson B, editors. The Time of Anthropology: Studies of Contemporary Chronopolitics. Abingdon: Routledge; 2020. Chapter 5. PMID: 36137063 Free Books & Documents. Review. - Expanded diversity of Asgard archaea and their relationships with eukaryotes.
Liu Y, Makarova KS, Huang WC, Wolf YI, Nikolskaya AN, Zhang X, Cai M, Zhang CJ, Xu W, Luo Z, Cheng L, Koonin EV, Li M. Liu Y, et al. Nature. 2021 May;593(7860):553-557. doi: 10.1038/s41586-021-03494-3. Epub 2021 Apr 28. Nature. 2021. PMID: 33911286 Free PMC article. - Comparison of Two Modern Survival Prediction Tools, SORG-MLA and METSSS, in Patients With Symptomatic Long-bone Metastases Who Underwent Local Treatment With Surgery Followed by Radiotherapy and With Radiotherapy Alone.
Lee CC, Chen CW, Yen HK, Lin YP, Lai CY, Wang JL, Groot OQ, Janssen SJ, Schwab JH, Hsu FM, Lin WH. Lee CC, et al. Clin Orthop Relat Res. 2024 Dec 1;482(12):2193-2208. doi: 10.1097/CORR.0000000000003185. Epub 2024 Jul 23. Clin Orthop Relat Res. 2024. PMID: 39051924 - Defining the optimum strategy for identifying adults and children with coeliac disease: systematic review and economic modelling.
Elwenspoek MM, Thom H, Sheppard AL, Keeney E, O'Donnell R, Jackson J, Roadevin C, Dawson S, Lane D, Stubbs J, Everitt H, Watson JC, Hay AD, Gillett P, Robins G, Jones HE, Mallett S, Whiting PF. Elwenspoek MM, et al. Health Technol Assess. 2022 Oct;26(44):1-310. doi: 10.3310/ZUCE8371. Health Technol Assess. 2022. PMID: 36321689 Free PMC article. - Trends in Surgical and Nonsurgical Aesthetic Procedures: A 14-Year Analysis of the International Society of Aesthetic Plastic Surgery-ISAPS.
Triana L, Palacios Huatuco RM, Campilgio G, Liscano E. Triana L, et al. Aesthetic Plast Surg. 2024 Oct;48(20):4217-4227. doi: 10.1007/s00266-024-04260-2. Epub 2024 Aug 5. Aesthetic Plast Surg. 2024. PMID: 39103642 Review.
Cited by
- Navigating the archaeal frontier: insights and projections from bioinformatic pipelines.
Karavaeva V, Sousa FL. Karavaeva V, et al. Front Microbiol. 2024 Sep 23;15:1433224. doi: 10.3389/fmicb.2024.1433224. eCollection 2024. Front Microbiol. 2024. PMID: 39380680 Free PMC article. - The emerging view on the origin and early evolution of eukaryotic cells.
Vosseberg J, van Hooff JJE, Köstlbacher S, Panagiotou K, Tamarit D, Ettema TJG. Vosseberg J, et al. Nature. 2024 Sep;633(8029):295-305. doi: 10.1038/s41586-024-07677-6. Epub 2024 Sep 11. Nature. 2024. PMID: 39261613 Review. - The Last Universal Common Ancestor of Ribosome-Encoding Organisms: Portrait of LUCA.
Forterre P. Forterre P. J Mol Evol. 2024 Oct;92(5):550-583. doi: 10.1007/s00239-024-10186-9. Epub 2024 Aug 19. J Mol Evol. 2024. PMID: 39158619 Review. - Nature should be the model for microbial sciences.
Baker BJ, Hyde E, Leão P. Baker BJ, et al. J Bacteriol. 2024 Sep 19;206(9):e0022824. doi: 10.1128/jb.00228-24. Epub 2024 Aug 19. J Bacteriol. 2024. PMID: 39158294 Free PMC article. Review. - Large attachment organelle mediates interaction between Nanobdellota archaeon YN1 and its host.
Johnson MD, Sakai HD, Paul B, Nunoura T, Dalvi S, Mudaliyar M, Shepherd DC, Shimizu M, Udupa S, Ohkuma M, Kurosawa N, Ghosal D. Johnson MD, et al. ISME J. 2024 Jan 8;18(1):wrae154. doi: 10.1093/ismejo/wrae154. ISME J. 2024. PMID: 39113594 Free PMC article.
References
Publication types
MeSH terms
Substances
LinkOut - more resources
Full Text Sources
Other Literature Sources


