CODATA Recommended Values of the Fundamental Physical Constants: 2018 - PubMed (original) (raw)
CODATA Recommended Values of the Fundamental Physical Constants: 2018
Eite Tiesinga et al. J Phys Chem Ref Data. 2021 Sep.
Abstract
We report the 2018 self-consistent values of constants and conversion factors of physics and chemistry recommended by the Committee on Data of the International Science Council. The recommended values can also be found at physics.nist.gov/constants. The values are based on a least-squares adjustment that takes into account all theoretical and experimental data available through 31 December 2018. A discussion of the major improvements as well as inconsistencies within the data is given. The former include a decrease in the uncertainty of the dimensionless fine-structure constant and a nearly two orders of magnitude improvement of particle masses expressed in units of kg due to the transition to the revised International System of Units (SI) with an exact value for the Planck constant. Further, because the elementary charge, Boltzmann constant, and Avogadro constant also have exact values in the revised SI, many other constants are either exact or have significantly reduced uncertainties. Inconsistencies remain for the gravitational constant and the muon magnetic-moment anomaly. The proton charge radius puzzle has been partially resolved by improved measurements of hydrogen energy levels.
Keywords: QED; Rydberg constant; conventional and SI electrical units; electron and muon g-factors; fine-structure constant; fundamental constants; precision measurements; proton radius; revised SI.
Figures
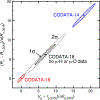
FIG. 1.
Covariance error ellipses for the proton radius _r_p and the Rydberg constant _R_∞ from the 2014 (blue marker and curve) and the current 2018 (red marker and curve) CODATA adjustment. The black marker and ellipses correspond to a 2018 adjustment where the experimental data from muonic hydrogen and muonic deuterium have not been included. Solid and dashed curves correspond to the one- and two-standard-uncertainty ellipses, respectively. The _x_- and _y_-axis data are shifted and normalized by the 2018 recommended values and standard uncertainties of _r_p and _R_∞, respectively.
FIG. 2.
Results of measurements relevant for determining the 2018 CODATA recommended value of the fine-structure constant α. Error bars correspond to one-standard-deviation uncertainties. Labels “Harvard-08,” “LKB-11,” and “Berkeley-18” denote the laboratories and the last two digits of the year in which the result was reported. The individual values for (_α_−1 − 137.03) × 105 are 599.9150(33), 599.8998(85), and 599.9048(28) for Harvard-08, LKB-11, and Berkeley-18, respectively. See discussion of this figure for references.
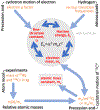
FIG. 3.
Relationships in the determinations of _E_h, α, _m_e, and _m_u (red text and symbols) as well as the theoretical and experimental means (black text with orange measured quantity) to determine their values. Blue directed arrows give the most commonly traversed connections between the constants and measured quantities.
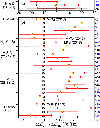
FIG. 4.
Experimental hydrogen and deuterium transition energies and differences of transition energies (yellow-filled red circles with red error bars) used as input data in the 2018 least-squares adjustment. For all data, the 2018 adjusted value of the transition energy has been subtracted. Data new to this adjustment have been indicated with the abbreviation of the name of the laboratory and year of publication in parentheses. An extensive list of abbreviations is found at the end of this report. Panel (a) shows data for the 1S − 2S transition with one-standard-deviation uncertainties on the order of tens of h × Hz. Panel (b) shows the remaining input data with uncertainties on the scale of tens of h × kHz. Labels on the left-hand side of the figure group data belonging to the same class of transitions, i.e., nℓ − n_′_ℓ_′ transitions. Input data without such label correspond to data that depend on (weighted) differences of four energy levels. Finally, the yellow-filled black circles with black error bars are the fitted values and their uncertainties. In the figure, the uncertainties of the input data have not been multiplied by 1.6, the expansion factor in this adjustment to make the H and D spectroscopic and muonic Lamb-shift data consistent. Fitted values are for the data when multiplied by this factor. Blue and black labels A_n on the right-hand side of the figure correspond to hydrogen and deuterium entries in Table X, respectively.
FIG. 5.
Fourteen fractional contributions to the theoretical anomaly of the electron |δa e|/_a_e(th). QED contributions are due to the mass-independent A1(2n) (yellow-filled black circles), to the muon-dependent A2(2n)(xeμ) (yellow-filled red circles), and to the tau-dependent A2(2n)(xeτ) (yellow-filled blue circles) corrections, respectively. Weak and hadronic corrections are also shown. The horizontal orange line shows the theoretical relative uncertainty of _a_e(th). The 2018 CODATA values for the fine-structure constant and lepton mass ratios are used here.
FIG. 6.
Input data for the determination of the relative atomic mass of the proton p. The input data (yellow-filled red circles with red error bars) and fitted values (yellow-filled black circles with black error bars) of the cyclotron frequency ratio of 12C6+ and p and the relative atomic mass of the hydrogen atom _A_r(1H) are shown. Error bars correspond to one-standard-deviation uncertainties. Datum X is shifted by the fitted value ⟨_X_⟩ and normalized by the standard uncertainty of the input datum. Thus, fitted values shift to zero and input data become normalized residuals. Dashed orange lines are the standard uncertainties of the input data multiplied by the 1.7 expansion factor that ensures a consistent fit.
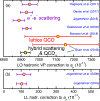
FIG. 7.
Comparison of recent determinations of the leading-order hadronic (LO) vacuum-polarization [panel (a)] and light-by-light (LL) [panel (b)] contributions to the muon anomaly. Error bars are one-standard-deviation uncertainties. The LO,VP, and LL contributions limit the uncertainty of _a_μ(th). The horizontal interval of the two panels is the same so that uncertainties can be compared. From top to bottom, data are from Hagiwara et al. (2011), Davier et al. (2017), Jegerlehner (2018), Keshavarzi, Nomura, and Teubner (2018), Borsanyi et al. (2018), and Blum et al. (2018) in panel (a) and from Jegerlehner and Nyffeler (2009) and Jegerlehner (2018) in panel (b).
FIG. 8.
Comparison of the experimental and theoretical value for the muon anomaly. Values have been scaled by the uncertainty of the 2018 recommended value.
FIG. 9.
The 16 input data determining the Newtonian constant of gravitation G ordered by publication year. The 2018 recommended value for G has been subtracted. Error bars correspond to one-standard-deviation uncertainties as reported in Table XXIX. The uncertainties after applying the 3.9 multiplicative expansion factor to determine the 2018 recommended value are not shown. Labels on the left side of the figure denote the laboratories and the last two digits of the year in which the data were reported. See Table XXIX for details. The gray band corresponds to the one-standard-deviation uncertainty of the recommended value.
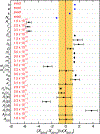
FIG. 10.
Comparison of a representative group of fundamental constants from the 2014 and 2018 CODATA adjustments. Symbols of constants are shown along the y axis. Along the x axis the 2018 recommended values and their one-standard-deviation uncertainty, black circles with error bars, are shown as the difference between the 2018 and 2014 values divided by the standard uncertainty of the 2014 value. The vertical solid red line at the origin and yellow/orange band of width 1 represent the 2014 values and standard uncertainties of the indicated constants. The numerical values near the left-hand side of the figure are the relative standard uncertainties from the 2018 adjustment.
Similar articles
- CODATA recommended values of the fundamental physical constants: 2018.
Tiesinga E, Mohr PJ, Newell DB, Taylor BN. Tiesinga E, et al. Rev Mod Phys. 2021 Apr-Jun;93(2):025010. doi: 10.1103/RevModPhys.93.025010. Epub 2021 Jun 30. Rev Mod Phys. 2021. PMID: 36733295 Free PMC article. - Is the proton radius a player in the redefinition of the International System of Units?
Nez F, Antognini A, Amaro FD, Biraben F, Cardoso JM, Covita D, Dax A, Dhawan S, Fernandes L, Giesen A, Graf T, Hänsch TW, Indelicato P, Julien L, Kao CY, Knowles PE, Le Bigot E, Liu YW, Lopes JA, Ludhova L, Monteiro CM, Mulhauser F, Nebel T, Rabinowitz P, dos Santos JM, Schaller L, Schuhmann K, Schwob C, Taqqu D, Veloso JF, Kottmann F, Pohl R. Nez F, et al. Philos Trans A Math Phys Eng Sci. 2011 Oct 28;369(1953):4064-77. doi: 10.1098/rsta.2011.0233. Philos Trans A Math Phys Eng Sci. 2011. PMID: 21930565 - Recommended Values of the Fundamental Physical Constants: A Status Report.
Taylor BN, Cohen ER. Taylor BN, et al. J Res Natl Inst Stand Technol. 1990 Sep-Oct;95(5):497-523. doi: 10.6028/jres.095.039. J Res Natl Inst Stand Technol. 1990. PMID: 28179787 Free PMC article. - History and progress on accurate measurements of the Planck constant.
Steiner R. Steiner R. Rep Prog Phys. 2013 Jan;76(1):016101. doi: 10.1088/0034-4885/76/1/016101. Epub 2012 Dec 18. Rep Prog Phys. 2013. PMID: 23249618 Review. - The determination of best values of the fundamental physical constants.
Taylor BN. Taylor BN. Philos Trans A Math Phys Eng Sci. 2005 Sep 15;363(1834):2105-22. doi: 10.1098/rsta.2005.1644. Philos Trans A Math Phys Eng Sci. 2005. PMID: 16147500 Review.
Cited by
- Not Normal: the uncertainties of scientific measurements.
Bailey DC. Bailey DC. R Soc Open Sci. 2017 Jan 11;4(1):160600. doi: 10.1098/rsos.160600. eCollection 2017 Jan. R Soc Open Sci. 2017. PMID: 28280557 Free PMC article. - Thermodynamic properties of 2-methylindole: experimental and computational results for gas-phase entropy and enthalpy of formation.
Chirico RD, Paulechka E, Bazyleva A, Kazakov AF. Chirico RD, et al. J Chem Thermodyn. 2018 Oct;125:10.1016/j.jct.2018.05.029. doi: 10.1016/j.jct.2018.05.029. J Chem Thermodyn. 2018. PMID: 39534676 Free PMC article. - SciPy 1.0: fundamental algorithms for scientific computing in Python.
Virtanen P, Gommers R, Oliphant TE, Haberland M, Reddy T, Cournapeau D, Burovski E, Peterson P, Weckesser W, Bright J, van der Walt SJ, Brett M, Wilson J, Millman KJ, Mayorov N, Nelson ARJ, Jones E, Kern R, Larson E, Carey CJ, Polat İ, Feng Y, Moore EW, VanderPlas J, Laxalde D, Perktold J, Cimrman R, Henriksen I, Quintero EA, Harris CR, Archibald AM, Ribeiro AH, Pedregosa F, van Mulbregt P; SciPy 1.0 Contributors. Virtanen P, et al. Nat Methods. 2020 Mar;17(3):261-272. doi: 10.1038/s41592-019-0686-2. Epub 2020 Feb 3. Nat Methods. 2020. PMID: 32015543 Free PMC article. Review. - Testing the Pauli Exclusion Principle across the Periodic Table with the VIP-3 Experiment.
Manti S, Bazzi M, Bortolotti N, Capoccia C, Cargnelli M, Clozza A, De Paolis L, Fiorini C, Guaraldo C, Iliescu M, Laubenstein M, Marton J, Napolitano F, Piscicchia K, Porcelli A, Scordo A, Sgaramella F, Sirghi DL, Sirghi F, Doce OV, Zmeskal J, Curceanu C. Manti S, et al. Entropy (Basel). 2024 Sep 2;26(9):752. doi: 10.3390/e26090752. Entropy (Basel). 2024. PMID: 39330085 Free PMC article. - Venus nightside surface temperature.
Singh D. Singh D. Sci Rep. 2019 Feb 4;9(1):1137. doi: 10.1038/s41598-018-38117-x. Sci Rep. 2019. PMID: 30718759 Free PMC article.
References
- Abe M, et al., 2019, Prog. Theor. Exp. Phys 2019, 053C02.
- Abe M, Murata Y, Iinuma H, Ogitsu T, Saito N, Sasaki K, Mibe T, and Nakayama H, 2018, Nucl. Instrum. Methods Phys. Res., Sect. A 890, 51.
- Adikaram D, et al., 2015, Phys. Rev. Lett 114, 062003. - PubMed
- Alarcón JM, Higinbotham DW, Weiss C, and Ye Z, 2019, Phys. Rev. C 99, 044303.
- Angeli I, and Marinova K, 2013, At. Data Nucl. Data Tables 99, 69.
LinkOut - more resources
Full Text Sources
