Range-wide whole-genome resequencing of the brown bear reveals drivers of intraspecies divergence - PubMed (original) (raw)
Range-wide whole-genome resequencing of the brown bear reveals drivers of intraspecies divergence
Menno J de Jong et al. Commun Biol. 2023.
Abstract
Population-genomic studies can shed new light on the effect of past demographic processes on contemporary population structure. We reassessed phylogeographical patterns of a classic model species of postglacial recolonisation, the brown bear (Ursus arctos), using a range-wide resequencing dataset of 128 nuclear genomes. In sharp contrast to the erratic geographical distribution of mtDNA and Y-chromosomal haplotypes, autosomal and X-chromosomal multi-locus datasets indicate that brown bear population structure is largely explained by recent population connectivity. Multispecies coalescent based analyses reveal cases where mtDNA haplotype sharing between distant populations, such as between Iberian and southern Scandinavian bears, likely results from incomplete lineage sorting, not from ancestral population structure (i.e., postglacial recolonisation). However, we also argue, using forward-in-time simulations, that gene flow and recombination can rapidly erase genomic evidence of former population structure (such as an ancestral population in Beringia), while this signal is retained by Y-chromosomal and mtDNA, albeit likely distorted. We further suggest that if gene flow is male-mediated, the information loss proceeds faster in autosomes than in X chromosomes. Our findings emphasise that contemporary autosomal genetic structure may reflect recent population dynamics rather than postglacial recolonisation routes, which could contribute to mtDNA and Y-chromosomal discordances.
© 2023. The Author(s).
Conflict of interest statement
The authors declare no competing interests.
Figures
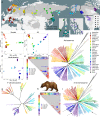
Fig. 1. Brown bear genetic structure: unlike single-locus (mtDNA and Y chromosome) clustering, multi-locus (autosomes and X chromosomes) clustering is largely explained by present-day population connectivity, except for a genomic discontinuity in western Siberia.
a Sample distribution. Dark and light grey: present-day and historical geographical range of brown bears (
). Symbol types indicate mtDNA haplotypes. Black lines indicate mtDNA discontinuities. The Ural Mountains (darkgrey shape) and the rivers Ob, Yenisei and Lena (from west to east) are depicted for reference. b–d PCoA-scatterplots based on allele sharing distances calculated from autosomal SNP data. e Residual heatmap for the dendrogram in f, depicting the difference between path lengths in the dendrogram relative to the actual genetic distances in the underlying distance matrix. Red (attraction) indicates that samples are more similar than suggested by the dendrogram, whereas blue (repulsion) indicates the opposite. f Unrooted ‘biological neighbour-joining’ (bioNJ) dendrogram (note: not evolutionary phylogeny) based on autosomal allele sharing distances. g Unrooted Y-chromosomal maximum-likelihood phylogeny (generated with the software RAXML), excluding the distant outgroup samples from the Middle East and Himalayas. h Residual heatmap for the dendrogram in i. i Unrooted bioNJ dendrogram depicting X-chromosomal Euclidean genetic distances. Arrows indicate samples or populations which cluster differently or have different branch lengths relative to the autosomal bioNJ dendrogram in f.
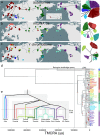
Fig. 2. Spatial distribution of genetic clusters, depicting the (in)consistencies between markers, possibly partly caused by incomplete lineage sorting.
Geographical distribution of individuals, with colour coding according to genetic cluster instead of population assignment. a Geographical map showing hierarchical clustering (using bioNJ method) of brown bear individuals based on Euclidean distances for autosomal SNP data. Lines connecting samples represent a minimum spanning tree (generated with the function ‘mst’ of the R-package ‘ape’), based on allele sharing distances. Inset: detail of minimum spanning tree in central Russia, which highlights that the transition in western Siberia between the western (red) and eastern (darkgreen) Eurasian clades is abrupt rather than gradual. b Geographical map showing the distribution of variants of mtDNA haplotype clade 3a, according to a maximum likelihood phylogeny generated with the software IQtree. c Geographical map showing the distribution of Y chromosome haplotypes (see d). d Rooted Y-chromosomal maximum-likelihood phylogeny, generated with the software IQtree. The phylogeny has been linearised using the mean path length method, and branch lengths have been converted in TMCRA-estimates assuming a mutation rate of 1.3 × 10⁻⁹ per site per year. Lightblue bars indicate confidence intervals of the node ages. Nodes with ultrafast bootstrap support values below 0.95 are highlighted in red. The colour bar on the righthand side corresponds to the genetic clusters in Fig. 2c. The tip colour coding (sample names) corresponds to population assignment as in Fig. 1. e Speculative model on Y-chromosomal phylogeography, with background grey shaded areas depicting population connectivity. Colours correspond to genetic clusters in Fig. 2c.
Fig. 3. Climate suitability modelling indicates that brown bears were absent from interior Alaska and eastern Siberia during the Last Glacial Maximum.
Climate suitability projections on brown bear climatic suitability ranges for various time periods suggest that the species range of brown bear has remained relatively stable (at least in Eurasia) for nearly 20ky, including during stadials. In contrast, the projection for the brown bear range during the Last Glacial Maximum differs markedly from the present-day species range, especially with regard to climatic suitability in eastern Siberia. Note that these maps show climatic suitability only. Not considered are potential additional limitations caused by biotic factors (e.g., vegetation), abiotic factors (e.g., ice cover) and migration barriers. Black dots indicate the geographic location of samples of populations which are marked by f3-analyses as admixed (‘Yakutia’ and ‘Alaska’, see Fig. 4a, b).
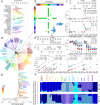
Fig. 4. Admixture analyses suggest hybridisation zones in Alaska and eastern Siberia (‘Yakutia’).
a Boxplots with overlaying stripcharts, depicting for all 7800 population triplets (A;B,C) the proportion of 50 Kb windows with a f3-score below zero, with the putatively admixed population A along the _y_-axis. The dashed line denotes an arbitrary cut-off at 0.57. b Matrix highlighting population triplets with negative genome-wide f3-score (above diagonal) or high proportions (>0.57) of 50 Kb windows with a negative f3-score (below diagonal), for all populations triplets (A;B,C). Colours along the _x_- and y-axes represent donor population B and C, while field colours denote admixed population A (i.e., Yakutia, Alaska, Sakhalin and CentreRus2). c Consistent with expectations, SLIM2 genetic forward-in-time simulations indicate that signals of former population structure (here estimated using f4- and FST-estimates) are lost in approximately 1/m generations, with m, migration rate, denoting the proportion of individuals that are immigrants. Initially, population p12 clusters with sister population p11, but gene flow ultimately causes p12 to cluster with unrelated population p22. d Phylogenetic network constructed with the ‘Neighbor-Net’ algorithm, based on genome-wide uncorrected genetic distances. The tiplabels of the outgroup (American black bears) are not shown. Polar bears cluster either with black bears or North American brown bears. Bears from the Middle East cluster either with European bears or Himalayan bears. Southwestern Alaskan (‘Aleutian’) bears cluster either with Alaskan bears or Kodiak bears. e SLIM2 simulations indicate that negative f3-scores can arise as a result of isolation-by-distance. f SLIM2 simulations indicate that, as a result of genetic drift, f3-scores increase every generation with a fixed value of ¼Ne, causing evidence of past pulse admixture events to eventually disappear. g Treemix maximum likelihood phylogeny with the four strongest admixture edges. Consistent with MSC-based analyses (Fig. 5A), the admixture edges suggest gene flow from Himalayan bears into Syrian bears (Middle East), as well as gene flow from polar bears into Hokkaido and North American brown bears. h Stacked barplots, generated with the R package LEA, depicting inferred ancestry coefficients assuming 6 or 7 ancestral populations. For each pair of closely related individuals, only one individual was included in the analysis.
Fig. 5. Multispecies coalescent (MSC) based analyses: testing for inequality of alternative quartet topology frequencies.
Graphical summary of MSC-based analyses on 3075 haploblocks of at minimum 25 kb length. Haploblocks were detected using Plink, and each haploblock dataset was phased with Beagle, generating two haplotypes per individual (which were randomly marked −1 and −2). Quartet frequencies were calculated and aggregated per population quartet using the software Twisst. The populations of Europe and Hokkaido were subdivided according to mtDNA clusters. Quartet frequencies were defined as t1, t2 and t3, referring respectively to the species tree topology q1, the most frequent alternative topology q2, and the less frequent alternative topology q3. a Heatmap depicting the ‘ingroup-score’, which we define as the proportion of quartets for which populations x and y group together in q2 and for which the hypothesis of equal alternative quartet topology frequencies (i.e., t2 ≈ t3) is rejected (based on a _z_-score threshold of 5), relative to the total number of quartets in which populations x and y are both present but do not group together in q1. The population pairs which occur most repeatedly as an ingroup of the more frequent alternative topology are: Alaska-Aleutian, Amur-Sakhalin, ABCbc-polar, Europe1b-MiddleEast, MiddleEast-Himalaya, ABCa-polar, polar-Westcoast, and Black-Westcoast. Outside of North America, an excess of polar bear genetic material is also found on Hokkaido Island. b ASTRAL supertree based on an input dataset of 3075 haploblock bioNJ trees. Nodes with local posterior probabilities below 0.8 are marked in red. Branch lengths are in coalescent units (2N generations). c Simplex depicting quartet topology frequencies (t1, t2 and t3) of all 31465 quartets. Red: quartets for which the null hypothesis of equal alternative quartet topology frequencies (i.e., t2 ≈ t3) was rejected, using a conservative z-score threshold of 5. Green (mirrored relative to y-axis): null hypothesis not rejected. d Reference phylogeny, used to distinguish between the species tree quartet topology (q1) and the two alternative quartet topologies (q1 and q2). This reference tree was constructed using Neighbor-joining clustering based on Nei’s genetic distances between populations, calculated from the autosomal SNP dataset. The tiplabel of the outgroup (American black bears) is not shown. e Barplots depicting quartet topology frequencies for an arbitrary subset of four quartets (out of all 31465 quartets). Dashed lines indicate the one-third quartet topology frequency threshold. Unequal frequencies of t2 and t3 suggest introgression between ABC brown bears and polar bears as well as between Syrian bears (‘Middle East’) and European bears. In contrast, no statistical support was found for an excess of discordant gene trees for South Scandinavian bears and Spanish bears (which both carry mtDNA haplotype 1b), and also not for bears from the Amur region and from Hokkaido which share mtDNA haplotype 3a. The latter findings question existing hypotheses on brown bear (postglacial) migration routes.
Fig. 6. Heterozygosity analyses reveal recent inbreeding on isolated mountain-tops, and ancient population bottlenecks in Kodiak and grizzly bears.
a Variation of heterozygosity levels (He) across a randomly chosen chromosome, for a random subset of samples, depicting He-levels of non-overlapping 20 kb windows, with grey segments highlighting the genomic regions which are marked as run of homozygosity (ROH) by the newly developed ROH-detection software Darwindow. Values along the y-axis represent sample and chromosome-specific FROH-values (proportion of chromosome marked as ROH). b Standard deviation of sample-specific FROH-values across chromosomes versus genome-wide mean FROH-values. High standard deviations are indicative of recent inbreeding events. c Mantel plot showing, for all (25 ∙ 24/2=) 300 brown bear population pairs, mean genome-wide genetic distance (DXY) versus geographic distance. d DXY-values against mean genome wide He-estimates, for all possible 300 population pairs. Population pairs involving bears from Middle East and North America affect the significance of the linear regression model. e Boxplots depicting sample-specific ROH-length and genome-wide He estimates, with samples grouped according to sample origin. Centre lines indicate median, and box limits indicate upper and lower quartiles. f SLIM2 genetic forward-in-time simulations indicate that following a population size reduction (from an initial Ne of 5000 individuals), and given sufficient time, ROH-distributions converge to a new equilibrium, with the relationship between FROH and number of ROHs depending on the new Ne. Shown are the number of generations since the population size reduction. g, h Sample specific ROH-distributions. The colour bar above the stacked barplot indicates population assignment.
Similar articles
- Molecular phylogeography of the brown bear (Ursus arctos) in Northeastern Asia based on analyses of complete mitochondrial DNA sequences.
Hirata D, Mano T, Abramov AV, Baryshnikov GF, Kosintsev PA, Vorobiev AA, Raichev EG, Tsunoda H, Kaneko Y, Murata K, Fukui D, Masuda R. Hirata D, et al. Mol Biol Evol. 2013 Jul;30(7):1644-52. doi: 10.1093/molbev/mst077. Epub 2013 Apr 25. Mol Biol Evol. 2013. PMID: 23619144 - Heterochronous mitogenomes shed light on the Holocene history of the Scandinavian brown bear.
Feinauer IS, Lord E, von Seth J, Xenikoudakis G, Ersmark E, Dalén L, Meleg IN. Feinauer IS, et al. Sci Rep. 2024 Oct 22;14(1):24917. doi: 10.1038/s41598-024-75028-6. Sci Rep. 2024. PMID: 39438503 Free PMC article. - Paths for colonization or exodus? New insights from the brown bear (Ursus arctos) population of the Cantabrian Mountains.
Gregório I, Barros T, Pando D, Morante J, Fonseca C, Ferreira E. Gregório I, et al. PLoS One. 2020 Jan 31;15(1):e0227302. doi: 10.1371/journal.pone.0227302. eCollection 2020. PLoS One. 2020. PMID: 32004321 Free PMC article. - Phylogeography, genetic diversity, and connectivity of brown bear populations in Central Asia.
Tumendemberel O, Zedrosser A, Proctor MF, Reynolds HV, Adams JR, Sullivan JM, Jacobs SJ, Khorloojav T, Tserenbataa T, Batmunkh M, Swenson JE, Waits LP. Tumendemberel O, et al. PLoS One. 2019 Aug 13;14(8):e0220746. doi: 10.1371/journal.pone.0220746. eCollection 2019. PLoS One. 2019. PMID: 31408475 Free PMC article. - Mitochondrial DNA under siege in avian phylogeography.
Zink RM, Barrowclough GF. Zink RM, et al. Mol Ecol. 2008 May;17(9):2107-21. doi: 10.1111/j.1365-294X.2008.03737.x. Epub 2008 Apr 3. Mol Ecol. 2008. PMID: 18397219 Review.
Cited by
- The origins and diversification of Holarctic brown bear populations inferred from genomes of past and present populations.
Segawa T, Rey-Iglesia A, Lorenzen ED, Westbury MV. Segawa T, et al. Proc Biol Sci. 2024 Jan 31;291(2015):20232411. doi: 10.1098/rspb.2023.2411. Epub 2024 Jan 24. Proc Biol Sci. 2024. PMID: 38264778 Free PMC article. - Mediterranean monk seal (Monachus monachus) and leopard seal (Hydrurga leptonyx) de novo genomes to study the demographic history and genetic diversity of southern seals.
Nebenführ M, Hamadou AB, Aguilar A, Borrell A, Gkafas GA, Janke A. Nebenführ M, et al. BMC Biol. 2025 Apr 16;23(1):102. doi: 10.1186/s12915-025-02207-w. BMC Biol. 2025. PMID: 40241156 Free PMC article. - Late Pleistocene polar bear genomes reveal the timing of allele fixation in key genes associated with Arctic adaptation.
Sun Y, Lorenzen ED, Westbury MV. Sun Y, et al. BMC Genomics. 2024 Sep 16;25(1):826. doi: 10.1186/s12864-024-10617-3. BMC Genomics. 2024. PMID: 39278943 Free PMC article. - Phylogeography of introgression: Spatial and temporal analyses identify two introgression events between brown and American black bears.
Puckett EE. Puckett EE. Heredity (Edinb). 2025 Jun;134(6):331-342. doi: 10.1038/s41437-025-00762-0. Epub 2025 Apr 19. Heredity (Edinb). 2025. PMID: 40253500 Free PMC article. - Genomic adaptation to small population size and saltwater consumption in the critically endangered Cat Ba langur.
Zhang L, Leonard N, Passaro R, Luan MS, Van Tuyen P, Han LTN, Cam NH, Vogelnest L, Lynch M, Fine AE, Nga NTT, Van Long N, Rawson BM, Behie A, Van Nguyen T, Le MD, Nadler T, Walter L, Marques-Bonet T, Hofreiter M, Li M, Liu Z, Roos C. Zhang L, et al. Nat Commun. 2024 Oct 2;15(1):8531. doi: 10.1038/s41467-024-52811-7. Nat Commun. 2024. PMID: 39358348 Free PMC article.
References
- Edwards S, Bensch S. Looking forwards or looking backwards in avian phylogeography? A comment on Zink and Barrowclough 2008. Mol. Ecol. 2009;18:2930–2933. - PubMed
- Toews DPL, Brelsford A. The biogeography of mitochondrial and nuclear discordance in animals. Mol. Ecol. 2012;21:3907–3930. - PubMed
- Cronin MA. In my experience: mitochondrial DNA in wildlife taxonomy and conservation biology: cautionary notes. Wildl. Soc. Bull. (1973-2006) 1993;21:339–348.
- Hewitt GM. Post-glacial re-colonization of European biota. Biol. J. Linn. Soc. 1999;68:87–112.
- McLennan, B. N., Proctor, M. F., Huber, D. & Michel, S. The IUCN Red List of Threatened Species (2017).
Publication types
MeSH terms
Substances
LinkOut - more resources
Full Text Sources
Miscellaneous


