Effect of long-term caloric restriction on DNA methylation measures of biological aging in healthy adults from the CALERIE trial - PubMed (original) (raw)
Randomized Controlled Trial
doi: 10.1038/s43587-022-00357-y. Epub 2023 Feb 9.
C P Ryan # 1, D L Corcoran 2, K M Huffman 3, M S Kobor 4, M Kothari 1, G H Graf 1 5, V B Kraus 3, W E Kraus 3, D T S Lin 4, C F Pieper 6, M E Ramaker 3, M Bhapkar 7, S K Das 8, L Ferrucci 9, W J Hastings 10, M Kebbe 11, D C Parker 12, S B Racette 13 14, I Shalev 10, B Schilling 15, D W Belsky 16 17
Affiliations
- PMID: 37118425
- PMCID: PMC10148951
- DOI: 10.1038/s43587-022-00357-y
Randomized Controlled Trial
Effect of long-term caloric restriction on DNA methylation measures of biological aging in healthy adults from the CALERIE trial
R Waziry et al. Nat Aging. 2023 Mar.
Erratum in
- Author Correction: Effect of long-term caloric restriction on DNA methylation measures of biological aging in healthy adults from the CALERIE trial.
Waziry R, Ryan CP, Corcoran DL, Huffman KM, Kobor MS, Kothari M, Graf GH, Kraus VB, Kraus WE, Lin DTS, Pieper CF, Ramaker ME, Bhapkar M, Das SK, Ferrucci L, Hastings WJ, Kebbe M, Parker DC, Racette SB, Shalev I, Schilling B, Belsky DW. Waziry R, et al. Nat Aging. 2023 Jun;3(6):753. doi: 10.1038/s43587-023-00432-y. Nat Aging. 2023. PMID: 37161091 Free PMC article. No abstract available.
Abstract
The geroscience hypothesis proposes that therapy to slow or reverse molecular changes that occur with aging can delay or prevent multiple chronic diseases and extend healthy lifespan1-3. Caloric restriction (CR), defined as lessening caloric intake without depriving essential nutrients4, results in changes in molecular processes that have been associated with aging, including DNA methylation (DNAm)5-7, and is established to increase healthy lifespan in multiple species8,9. Here we report the results of a post hoc analysis of the influence of CR on DNAm measures of aging in blood samples from the Comprehensive Assessment of Long-term Effects of Reducing Intake of Energy (CALERIE) trial, a randomized controlled trial in which n = 220 adults without obesity were randomized to 25% CR or ad libitum control diet for 2 yr (ref. 10). We found that CALERIE intervention slowed the pace of aging, as measured by the DunedinPACE DNAm algorithm, but did not lead to significant changes in biological age estimates measured by various DNAm clocks including PhenoAge and GrimAge. Treatment effect sizes were small. Nevertheless, modest slowing of the pace of aging can have profound effects on population health11-13. The finding that CR modified DunedinPACE in a randomized controlled trial supports the geroscience hypothesis, building on evidence from small and uncontrolled studies14-16 and contrasting with reports that biological aging may not be modifiable17. Ultimately, a conclusive test of the geroscience hypothesis will require trials with long-term follow-up to establish effects of intervention on primary healthy-aging endpoints, including incidence of chronic disease and mortality18-20.
© 2023. The Author(s).
Conflict of interest statement
D.L.C. and D.W.B. are listed as inventors on a Duke University and University of Otago invention, DunedinPACE, that was licensed to a commercial entity. The other authors declare no competing interests.
Figures
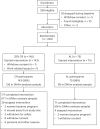
Fig. 1. Consort diagram for the CALERIE Trial.
DNAm was assayed from blood samples collected at baseline, 12 months and 24 months. Of the n = 197 participants for whom DNAm data were available from baseline and at least one follow-up assessment, baseline to 12-month change was measured for n = 125 CR and n = 66 AL participants and baseline to 24-month change was measured for n = 117 CR and n = 68 AL participants.
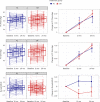
Fig. 2. Change from baseline to 12- and 24-month follow-up in DNAm measures of aging in the AL and CR groups in the CALERIE Trial.
The figure shows CALERIE Trial treatment effects on three DNAm measures of aging, the PC PhenoAge clock, the PC GrimAge clock and DunedinPACE. Values for the AL control group (n = 69 participants) are graphed in blue. Values for the CR treatment group (n = 128 participants) are graphed in red. For the PhenoAge and GrimAge DNAm clocks, values are denominated in ‘years’ of DNAm age. For the clocks, expected change under the null hypothesis is 1 yr at 12-month follow-up and 2 yr at 24-month follow-up. For the DunedinPACE measure, values are denominated in pace-of-aging units scaled to be interpretable as percentage difference in the rate of aging relative to the reference norm of 1 yr of biological decline per calendar year. For DunedinPACE, expected change under the null hypothesis is zero. The left column of the figure shows box plots of the observed values of the measures at baseline and 12- and 24-month follow-ups. The boxes show the interquartile range; the whiskers show 1.5× the interquartile range; the center line shows the median; individual participant data are plotted as dots and connected with lines. For the PC PhenoAge and PC GrimAge DNAm clocks, the box plots show similar patterns of increase in both AL and CR groups. For DunedinPACE, the box plot shows stability in the AL group and decrease in the CR group. The right column of the figure shows mean values of change from baseline and 95% CIs estimated from mixed models at the 12- and 24-month follow-ups for the AL and CR groups. There is no confidence interval estimated for baseline because change from baseline is exactly zero at this timepoint. For the PC PhenoAge and PC GrimAge DNAm clocks, mean change is similar in the AL and CR groups. For DunedinPACE, mean change is positive in the AL group (although the confidence interval overlaps zero at 24 months) and negative in the CR group. mo, months. Source data
Similar articles
- Change in the Rate of Biological Aging in Response to Caloric Restriction: CALERIE Biobank Analysis.
Belsky DW, Huffman KM, Pieper CF, Shalev I, Kraus WE. Belsky DW, et al. J Gerontol A Biol Sci Med Sci. 2017 Dec 12;73(1):4-10. doi: 10.1093/gerona/glx096. J Gerontol A Biol Sci Med Sci. 2017. PMID: 28531269 Free PMC article. Clinical Trial. - Effects of caloric restriction on human physiological, psychological, and behavioral outcomes: highlights from CALERIE phase 2.
Dorling JL, van Vliet S, Huffman KM, Kraus WE, Bhapkar M, Pieper CF, Stewart T, Das SK, Racette SB, Roberts SB, Ravussin E, Redman LM, Martin CK; CALERIE Study Group. Dorling JL, et al. Nutr Rev. 2021 Jan 1;79(1):98-113. doi: 10.1093/nutrit/nuaa085. Nutr Rev. 2021. PMID: 32940695 Free PMC article. Clinical Trial. - Effect of long-term caloric restriction on telomere length in healthy adults: CALERIE™ 2 trial analysis.
Hastings WJ, Ye Q, Wolf SE, Ryan CP, Das SK, Huffman KM, Kobor MS, Kraus WE, MacIsaac JL, Martin CK, Racette SB, Redman LM, Belsky DW, Shalev I. Hastings WJ, et al. Aging Cell. 2024 Jun;23(6):e14149. doi: 10.1111/acel.14149. Epub 2024 Mar 19. Aging Cell. 2024. PMID: 38504468 Free PMC article. Clinical Trial. - The CALERIE Study: design and methods of an innovative 25% caloric restriction intervention.
Rickman AD, Williamson DA, Martin CK, Gilhooly CH, Stein RI, Bales CW, Roberts S, Das SK. Rickman AD, et al. Contemp Clin Trials. 2011 Nov;32(6):874-81. doi: 10.1016/j.cct.2011.07.002. Epub 2011 Jul 8. Contemp Clin Trials. 2011. PMID: 21767664 Free PMC article. Review. - Nutrition modulation of human aging: The calorie restriction paradigm.
Das SK, Balasubramanian P, Weerasekara YK. Das SK, et al. Mol Cell Endocrinol. 2017 Nov 5;455:148-157. doi: 10.1016/j.mce.2017.04.011. Epub 2017 Apr 12. Mol Cell Endocrinol. 2017. PMID: 28412520 Free PMC article. Review.
Cited by
- Proteomic aging clock (PAC) predicts age-related outcomes in middle-aged and older adults.
Kuo CL, Chen Z, Liu P, Pilling LC, Atkins JL, Fortinsky RH, Kuchel GA, Diniz BS. Kuo CL, et al. medRxiv [Preprint]. 2024 Apr 21:2023.12.19.23300228. doi: 10.1101/2023.12.19.23300228. medRxiv. 2024. PMID: 38196645 Free PMC article. Updated. Preprint. - Probiotics, prebiotics, synbiotics and other microbiome-based innovative therapeutics to mitigate obesity and enhance longevity via the gut-brain axis.
Boyajian JL, Islam P, Abosalha A, Schaly S, Thareja R, Kassab A, Arora K, Santos M, Shum-Tim C, Prakash S. Boyajian JL, et al. Microbiome Res Rep. 2024 May 17;3(3):29. doi: 10.20517/mrr.2024.05. eCollection 2024. Microbiome Res Rep. 2024. PMID: 39421246 Free PMC article. Review. - Clinical Trials Targeting Aging.
Nielsen JL, Bakula D, Scheibye-Knudsen M. Nielsen JL, et al. Front Aging. 2022 Feb 4;3:820215. doi: 10.3389/fragi.2022.820215. eCollection 2022. Front Aging. 2022. PMID: 35821843 Free PMC article. Review. - Low blood levels of selenium, selenoprotein P and GPx3 are associated with accelerated biological aging: results from the Berlin Aging Study II (BASE-II).
Vetter VM, Demircan K, Homann J, Chillon TS, Mülleder M, Shomroni O, Steinhagen-Thiessen E, Ralser M, Lill CM, Bertram L, Schomburg L, Demuth I. Vetter VM, et al. Clin Epigenetics. 2025 Apr 25;17(1):62. doi: 10.1186/s13148-025-01863-7. Clin Epigenetics. 2025. PMID: 40275394 Free PMC article. - Delaying liver aging: Analysis of structural and functional alterations.
Yao YQ, Cao QY, Li Z. Yao YQ, et al. World J Gastroenterol. 2025 Apr 21;31(15):103773. doi: 10.3748/wjg.v31.i15.103773. World J Gastroenterol. 2025. PMID: 40309235 Free PMC article.
References
Publication types
MeSH terms
Grants and funding
- U24 AG066528/AG/NIA NIH HHS/United States
- R01 AG066887/AG/NIA NIH HHS/United States
- R03 AG071549/AG/NIA NIH HHS/United States
- P30 AG028716/AG/NIA NIH HHS/United States
- R01 AG054840/AG/NIA NIH HHS/United States
- R01 AG061378/AG/NIA NIH HHS/United States
LinkOut - more resources
Full Text Sources

