The human cell count and size distribution - PubMed (original) (raw)
The human cell count and size distribution
Ian A Hatton et al. Proc Natl Acad Sci U S A. 2023.
Abstract
Cell size and cell count are adaptively regulated and intimately linked to growth and function. Yet, despite their widespread relevance, the relation between cell size and count has never been formally examined over the whole human body. Here, we compile a comprehensive dataset of cell size and count over all major cell types, with data drawn from >1,500 published sources. We consider the body of a representative male (70 kg), which allows further estimates of a female (60 kg) and 10-y-old child (32 kg). We build a hierarchical interface for the cellular organization of the body, giving easy access to data, methods, and sources (https://humancelltreemap.mis.mpg.de/). In total, we estimate total body counts of ≈36 trillion cells in the male, ≈28 trillion in the female, and ≈17 trillion in the child. These data reveal a surprising inverse relation between cell size and count, implying a trade-off between these variables, such that all cells within a given logarithmic size class contribute an equal fraction to the body's total cellular biomass. We also find that the coefficient of variation is approximately independent of mean cell size, implying the existence of cell-size regulation across cell types. Our data serve to establish a holistic quantitative framework for the cells of the human body, and highlight large-scale patterns in cell biology.
Keywords: cell biomass; cell count; cell size; size distribution; size homeostasis.
Conflict of interest statement
The authors declare no competing interest.
Figures
Fig. 1.
Contrasting cell count and biomass distributions by cell type. Voronoi tree maps for all 400 investigated cell types of the reference male anatomical model (area represents relative cell number or biomass). (A) Cell counts are dominated by red blood cells and platelets, which are removed from the cell count tree map. Even after removing nonnucleated blood cells (≈29 trillion), white blood cells (≈3.4 trillion) still dominate the ≈7 trillion nucleated cell count, with 98% of white blood cells as tissue resident, 1% circulating and 1% intravascular marginating. (B) Cell biomass is dominated by skeletal myocytes, comprising about half of all 45 kg of cell biomass in the body, even though they make up <0.002% of the nucleated cell count, which are removed from the biomass tree map. Most of the remaining 23.5 kg of cell biomass are white adipocytes (≈12 kg; though body fat varies widely among subjects). Tree maps for a reference 60-kg female (≈28 trillion cells) and 32-kg child (≈17 trillion cells), and more detailed cell groups and organ systems can be explored at
https://humancelltreemap.mis.mpg.de/
(
SI Appendix, Figs. S7–S9
).
Fig. 2.
Cell class distributions across select tissues. Cell count and biomass distributions across 18 broad cell classes (colored) are shown for the 32 most significant tissue systems of the body, representing about half of all 60 investigated tissue systems, including the vast majority of total cell biomass. Numerical values refer to a reference male except for the female breasts, uterus, and ovaries. Most tissue systems are dominated by the ≈140 distinct cell types making up the epithelial cell class. “CNS” and “PNS” refer to central and peripheral nervous systems, respectively. The “Other blood cell” class is dominated by macrophages, but includes monocytes and precursors to red blood cells and platelets. Cell biomass excludes noncellular components of biomass in each tissue, made up of extracellular water, protein, and minerals (~25 kg; see
SI Appendix
). The blood cells of the blood organs and intravascular are shown separately in Fig. 1.
Fig. 3.
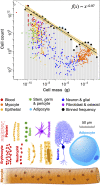
Human cell size and count are nearly inversely related. Data and regression are shown for a 70-kg reference male, though very similar patterns are found for female and child (
SI Appendix, Fig. S5
). The total number of cells in each of 26 logarithmic size classes is regressed against cell mass (g), giving a slope near −0.97, as shown by the black line fit to black circles. The yellow band shows the 95% CI (±0.1), while the dashed gray line shows a reference slope of −1. Small colored circles (n = 700) include 401 distinct cell types, in addition to single cell types that have large variation in size (e.g., adipocytes, neurons and myocytes). These points represent mean cell-size values for each cell group, and are aggregated over their size range into size class sums represented by black points (Materials and Methods). In some cases, cells with broad size distributions (e.g., adipocytes; light blue) have counts of mean sizes that are higher than the size class sum (black points), since the counts of actual sizes are spread lognormally over multiple size classes. The open gray circle (Top Left) is the bacterial microbiome (17).
Fig. 4.
Cellular biomass and cell-size variation. The number of cells in a group multiplied by cell mass gives total biomass of a cell group. (A) Numerical counts (from Fig. 3) are transformed to total cellular biomass within a size class, and show little systematic variation with log cell mass. Here we show female cell biomass, which is broadly similar to the male and child (as shown in B on linear axes). Horizontal colored bands represent approximate size ranges based on literature values. In some cases, the biomass of a cell type (colored points) may be greater than the size class sum if that cell type is broadly distributed (e.g., adipocyte and myocyte). (B) Cell biomass can also be displayed on linear axes to highlight irregularities, particularly among the largest cell types (adipocytes and myocytes). Male, female, and 10-y-old child are broadly similar, though the child displays a slightly more even distribution of biomass (
SI Appendix, Fig. S5
).
Fig. 5.
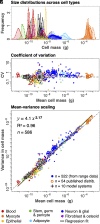
Size variation across cell types. (A) Published size distributions of select human cell types (colored; n = 30) and cell-size model systems (gray; n = 10) are normalized and found to be well approximated by a log-normal distribution (Materials and Methods;
SI Appendix, Fig. S2
). (B) The CV (SD divided by mean cell mass) shows little tendency to vary systematically with mean size across the full range of cell types. (C) The variance in cell mass for each cell type scales as a power law with exponent 2.17 (±0.04) against mean cell mass across all cell groups. Small solid points in B and C derive from estimates of SD from size ranges in our dataset (n = 522). Open circles (n = 54) are from prior published distributions and black shapes (n = 10) are from cell-size model systems shown in A (see
SI Appendix, Fig. S2
for legend, and Materials and Methods and
SI Appendix
for sources).
Fig. 6.
Summary of blood cell distribution across blood organs and other tissues. Blood cell size and count are estimated for each of the intravascular, major blood organs and over all remaining tissues. Numerical values refer to a reference male. These estimates derive from reported total biomass of each major tissue system. The relative biomass fraction for each tissue is shown as a hatched shaded gray bar in the leftmost column. The first row (intravascular) shows the same data as the second, except that nonnucleated red blood cells and platelets are removed (as in Fig. 1_A_). Total cell biomass (kg) and cell count in each system are partitioned into eight blood cell groups (colored bars) based on a variety of methods. We highlight where our methods and estimates differ with prior published sources.
Similar articles
- Folic acid supplementation and malaria susceptibility and severity among people taking antifolate antimalarial drugs in endemic areas.
Crider K, Williams J, Qi YP, Gutman J, Yeung L, Mai C, Finkelstain J, Mehta S, Pons-Duran C, Menéndez C, Moraleda C, Rogers L, Daniels K, Green P. Crider K, et al. Cochrane Database Syst Rev. 2022 Feb 1;2(2022):CD014217. doi: 10.1002/14651858.CD014217. Cochrane Database Syst Rev. 2022. PMID: 36321557 Free PMC article. - Studies of human adipose tissue. Adipose cell size and number in nonobese and obese patients.
Salans LB, Cushman SW, Weismann RE. Salans LB, et al. J Clin Invest. 1973 Apr;52(4):929-41. doi: 10.1172/JCI107258. J Clin Invest. 1973. PMID: 4693656 Free PMC article. - [Relationship between refractive elements and morphometry of corneal endothelial cells in normal eyes of young Japanese].
Yamaguchi H, Kajita M. Yamaguchi H, et al. Nippon Ganka Gakkai Zasshi. 1994 Jun;98(6):566-74. Nippon Ganka Gakkai Zasshi. 1994. PMID: 8030571 Japanese. - Sutureless Aortic Valve Replacement for Treatment of Severe Aortic Stenosis: A Single Technology Assessment of Perceval Sutureless Aortic Valve [Internet].
Desser AS, Arentz-Hansen H, Fagerlund BF, Harboe I, Lauvrak V. Desser AS, et al. Oslo, Norway: Knowledge Centre for the Health Services at The Norwegian Institute of Public Health (NIPH); 2017 Aug 25. Report from the Norwegian Institute of Public Health No. 2017-01. Oslo, Norway: Knowledge Centre for the Health Services at The Norwegian Institute of Public Health (NIPH); 2017 Aug 25. Report from the Norwegian Institute of Public Health No. 2017-01. PMID: 29553663 Free Books & Documents. Review. - Ecological correlates of body size in relation to cell size and cell number: patterns in flies, fish, fruits and foliage.
Arendt J. Arendt J. Biol Rev Camb Philos Soc. 2007 May;82(2):241-56. doi: 10.1111/j.1469-185X.2007.00013.x. Biol Rev Camb Philos Soc. 2007. PMID: 17437559 Review.
Cited by
- Proteomic reference map for sarcopenia research: mass spectrometric identification of key muscle proteins of organelles, cellular signaling, bioenergetic metabolism and molecular chaperoning.
Dowling P, Gargan S, Zweyer M, Henry M, Meleady P, Swandulla D, Ohlendieck K. Dowling P, et al. Eur J Transl Myol. 2024 May 24;34(2):12565. doi: 10.4081/ejtm.2024.12565. Eur J Transl Myol. 2024. PMID: 38787292 Free PMC article. - Plasma membrane folding enables constant surface area-to-volume ratio in growing mammalian cells.
Wu W, Lam AR, Suarez K, Smith GN, Duquette SM, Yu J, Mankus D, Bisher M, Lytton-Jean A, Manalis SR, Miettinen TP. Wu W, et al. bioRxiv [Preprint]. 2025 Feb 17:2024.07.02.601447. doi: 10.1101/2024.07.02.601447. bioRxiv. 2025. PMID: 39005340 Free PMC article. Updated. Preprint. - Human embryonic genetic mosaicism and its effects on development and disease.
Waldvogel SM, Posey JE, Goodell MA. Waldvogel SM, et al. Nat Rev Genet. 2024 Oct;25(10):698-714. doi: 10.1038/s41576-024-00715-z. Epub 2024 Apr 11. Nat Rev Genet. 2024. PMID: 38605218 Free PMC article. Review. - The Efficiency of In Vitro Differentiation of Primate iPSCs into Cardiomyocytes Depending on Their Cell Seeding Density and Cell Line Specificity.
Tereshchenko Y, Petkov SG, Behr R. Tereshchenko Y, et al. Int J Mol Sci. 2024 Aug 2;25(15):8449. doi: 10.3390/ijms25158449. Int J Mol Sci. 2024. PMID: 39126016 Free PMC article. - Clonal Extinction Drives Tumorigenesis.
Amaro A, Pfeffer U. Amaro A, et al. Cancers (Basel). 2023 Sep 28;15(19):4761. doi: 10.3390/cancers15194761. Cancers (Basel). 2023. PMID: 37835454 Free PMC article.
References
- Conlon I., Raff M., Size control in animal development. Cell 96, 235–244 (1999). - PubMed
Publication types
MeSH terms
LinkOut - more resources
Full Text Sources
Other Literature Sources


