Effectiveness of Time-Restricted Eating with Caloric Restriction vs. Caloric Restriction for Weight Loss and Health: Meta-Analysis - PubMed (original) (raw)
Review
Effectiveness of Time-Restricted Eating with Caloric Restriction vs. Caloric Restriction for Weight Loss and Health: Meta-Analysis
Tanja Črešnovar et al. Nutrients. 2023.
Abstract
Time-restricted eating (TRE) is an increasingly popular dietary strategy for weight loss. Recent studies suggest that combining TRE with caloric restriction (CR) may have more favorable effects on both physical and biochemical aspects when compared with CR alone. Therefore, we performed a meta-analysis to compare the effects of TRE with CR vs. CR alone on anthropometric and biochemical measures in overweight or obese adults. We reviewed articles from PubMed, Web of science, EMBASE, and the Cochrane Library published before 25 May 2023. The meta-analysis incorporated data from seven randomized controlled trials of nine interventions, with a total of 231 participants in the TRE with CR group and 227 participants in the CR-only group. Data were analyzed using RewMan version 5.4.1. All results in our meta-analysis were described as mean difference (MD) with 95% confidence interval (Cl). Results showed that TRE with CR compared to CR alone resulted in significantly greater reductions in body weight (MD: -2.11 kg, 95% CI: -2.68 kg to -1.54 kg, p = < 0.00001, _I_2 = 42%), body fat mass (MD: -0.75 kg, 95% CI: -1.35 kg to -0.16 kg, p = 0.01; _I_2 = 0%), and waist circumference (MD: -1.27 cm, 95% CI: -2.36 cm to -0.19 cm, p = 0.02, _I_2 = 0%), while no additional impact of TRE in combination with CR in comparison to CR on serum biochemical parameters were found. Our results suggest that the improvement in biochemical parameters are mainly caused by CR, while improvements in anthropometric parameters are further enhanced by TRE.
Keywords: caloric restriction; fasting glucose; lipid profile; obesity; overweight; time-restricted eating; weight loss.
Conflict of interest statement
The authors declare no conflict of interest.
Figures
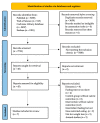
Figure 1
PRISMA flow diagram.
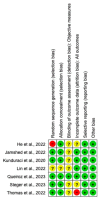
Figure 2
Risk of bias assessment in the RCT s included in the meta-analysis. Criteria for each included RCTs according to Cochrane Risk-of-Bias tool. Abbreviations: −, low risk [7]; ?, unclear risk [13,14,15,16]; +, high risk [11,12] in the PRISMA flow diagram.
Figure 3
Effect of TRE with CR vs. CR on changes in BW (in kg). Interventions divided into subgroups (eTRE, lTRE, mTRE). MD indicates the mean difference of change from TRE with CR vs. CR. The plotted points are the MDs, and the horizontal error bars represent the 95% confidence intervals. Abbreviations: CR, caloric restriction; eTRE, early time-restricted eating; lTRE, late time-restricted eating; TRE, time-restricted eating; mTRE, undefined beginning of time-restricted eating. The diamond at the base of the plot demonstrates the pooled effect estimates and confidence intervals from all RCTs included in the meta-analysis [7,11,12,13,14,15,16].
Figure 4
Random effect of TRE with CR vs. CR on changes in BW (in kg). MD indicates the mean difference of change from eTRE with CR vs. CR. The plotted points are the MDs, and the horizontal error bars represent the 95% confidence intervals. Abbreviations: CR, caloric restriction; eTRE, early time-restricted eating. The diamond at the base of the plot demonstrates the pooled effect estimates and confidence intervals from all RCTs included in the meta-analysis [7,11,12,13,16].
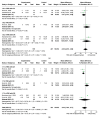
Figure 5
Effect of TRE with CR vs. CR on changes in (a) FM (in kg) and (b) FFM (in kg). Intervent-ions were divided into subgroups (eTRE, lTRE, mTRE). MD indicates the mean difference of change from TRE with CR vs. CR. The plotted points are the MDs, and the horizontal error bars represent the 95% confidence intervals. Abbreviations: CR, caloric restriction; eTRE, early time-restricted eating; lTRE, late time-restricted eating; TRE, time-restricted eating; mTRE, undefined beginning of time-restricted eating. The diamond at the base of the plot demonstrates the pooled effect estimates and confidence intervals from all RCTs included in the meta-analysis [7,11,12,13,14,15,16].
Figure 6
Effect of TRE with CR vs. CR on WC (in cm). Interventions divided in subgroups (eTRE, lTRE, mTRE). MD indicates the mean difference of change from TRE with CR vs. CR. The plotted points are the MDs, and the horizontal error bars represent the 95% confidence intervals. Abbreviations: CR, caloric restriction; eTRE, early time-restricted eating; lTRE, late time-restricted eating; TRE, time-restricted eating; mTRE, undefined beginning of time-restricted eating. The diamond at the base of the plot demonstrates the pooled effect estimates and confidence intervals from all RCTs included in the meta-analysis [11,14,15,16].
Figure 7
Effect of TRE with CR vs. CR on changes in (a) SBP (in mmHg) and (b) DBP in (mmHg). Interventions were divided in subgroups (eTRE, lTRE, mTRE). MD indicates the mean difference of change from TRE with CR vs. CR. The plotted points are the MDs, and the horizontal error bars represent the 95% confidence intervals. Abbreviations: CR, caloric restriction; eTRE, early time-res- tricted eating; lTRE, late time-restricted eating; TRE, time-restricted eating; mTRE, undefined beginning of time-restricted eating. The diamond at the base of the plot demonstrates the pooled effect estimates and confidence intervals from all RCTs included in the meta-analysis [11,14,15,16].
Figure 8
Effects of TRE with CR vs. CR on changes in (a) FG (in mg/dL), (b) TC (in mg/dL), (c) HDL cholesterol (in mg/dL), (d) LDL cholesterol (in mg/dL), and (e) TG (in mg/dL). Interventions were divided in subgroups (eTRE, lTRE, mTRE). MD indicates the mean difference of change from TRE with CR vs. CR. The plotted points are the MDs, and the horizontal error bars represent the 95% confidence intervals. Abbreviations: CR, caloric restriction; eTRE, early time-restricted eating; lTRE, late time-restricted eating; TRE, time-restricted eating; mTRE, undefined beginning of time-restricted eating. The diamond at the base of the plot demonstrates the pooled effect estimates and confidence intervals from all RCTs included in the meta-analysis [7,14,15,16].
Similar articles
- Time-restricted eating with calorie restriction on weight loss and cardiometabolic risk: a systematic review and meta-analysis.
Sun JC, Tan ZT, He CJ, Hu HL, Zhai CL, Qian G. Sun JC, et al. Eur J Clin Nutr. 2023 Nov;77(11):1014-1025. doi: 10.1038/s41430-023-01311-w. Epub 2023 Jul 24. Eur J Clin Nutr. 2023. PMID: 37488260 Free PMC article. Review. - Does time-restricted eating add benefits to calorie restriction? A systematic review.
Ezzati A, McLaren C, Bohlman C, Tamargo JA, Lin Y, Anton SD. Ezzati A, et al. Obesity (Silver Spring). 2024 Apr;32(4):640-654. doi: 10.1002/oby.23984. Epub 2024 Feb 21. Obesity (Silver Spring). 2024. PMID: 38383703 Review. - Is time-restricted eating (8/16) beneficial for body weight and metabolism of obese and overweight adults? A systematic review and meta-analysis of randomized controlled trials.
Huang L, Chen Y, Wen S, Lu D, Shen X, Deng H, Xu L. Huang L, et al. Food Sci Nutr. 2022 Dec 19;11(3):1187-1200. doi: 10.1002/fsn3.3194. eCollection 2023 Mar. Food Sci Nutr. 2022. PMID: 36911845 Free PMC article. Review. - Effect of Time-Restricted Eating versus Daily Calorie Restriction on Mood and Quality of Life in Adults with Obesity.
Lin S, Cienfuegos S, Ezpeleta M, Pavlou V, Chakos K, McStay M, Runchey MC, Alexandria SJ, Varady KA. Lin S, et al. Nutrients. 2023 Oct 10;15(20):4313. doi: 10.3390/nu15204313. Nutrients. 2023. PMID: 37892388 Free PMC article. Clinical Trial.
Cited by
- Time-Restricted Feeding Attenuates Metabolic Dysfunction-Associated Steatohepatitis and Hepatocellular Carcinoma in Obese Male Mice.
Das M, Kumar D, Sauceda C, Oberg A, Ellies LG, Zeng L, Jih LJ, Newton IG, Webster NJG. Das M, et al. Cancers (Basel). 2024 Apr 16;16(8):1513. doi: 10.3390/cancers16081513. Cancers (Basel). 2024. PMID: 38672595 Free PMC article.
References
Publication types
MeSH terms
LinkOut - more resources
Full Text Sources
Medical


