The hagfish genome and the evolution of vertebrates - PubMed (original) (raw)
The hagfish genome and the evolution of vertebrates
Ferdinand Marlétaz et al. Nature. 2024 Mar.
Abstract
As the only surviving lineages of jawless fishes, hagfishes and lampreys provide a crucial window into early vertebrate evolution1-3. Here we investigate the complex history, timing and functional role of genome-wide duplications4-7 and programmed DNA elimination8,9 in vertebrates in the light of a chromosome-scale genome sequence for the brown hagfish Eptatretus atami. Combining evidence from syntenic and phylogenetic analyses, we establish a comprehensive picture of vertebrate genome evolution, including an auto-tetraploidization (1RV) that predates the early Cambrian cyclostome-gnathostome split, followed by a mid-late Cambrian allo-tetraploidization (2RJV) in gnathostomes and a prolonged Cambrian-Ordovician hexaploidization (2RCY) in cyclostomes. Subsequently, hagfishes underwent extensive genomic changes, with chromosomal fusions accompanied by the loss of genes that are essential for organ systems (for example, genes involved in the development of eyes and in the proliferation of osteoclasts); these changes account, in part, for the simplification of the hagfish body plan1,2. Finally, we characterize programmed DNA elimination in hagfish, identifying protein-coding genes and repetitive elements that are deleted from somatic cell lineages during early development. The elimination of these germline-specific genes provides a mechanism for resolving genetic conflict between soma and germline by repressing germline and pluripotency functions, paralleling findings in lampreys10,11. Reconstruction of the early genomic history of vertebrates provides a framework for further investigations of the evolution of cyclostomes and jawed vertebrates.
© 2024. The Author(s).
Conflict of interest statement
The authors declare no competing interests.
Figures
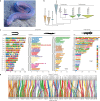
Fig. 1. Phylogenetic relationships and syntenic architecture of cyclostomes and gnathostomes.
a, The brown hagfish, Eptatretus atami (photo credit, M. Suzuki). b, Summary of deuterostome phylogeny based on 176 selected genes (61,939 positions) using a site-heterogeneous model (CAT+GTR). This topology is robust to compositional heterogeneity and similar to what was obtained with 1,467 genes using a site-homogeneous partitioned model (see Methods, Supplementary Note 1 and Extended Data Fig. 2). c, Karyograms showing the ancestry of hagfish, lamprey and gar chromosomes in terms of chordate linkage groups (CLGs A1, A2 and B–Q) described previously, (see also ref. and Supplementary Note 2). Coloured bins contain 20 genes and only genes from CLGs with significant enrichment (Fisher’s exact test) are counted (Methods). Hagfish, lamprey and gar silhouettes downloaded from PhyloPic (credit to Gareth Monger for lamprey). d, Conserved syntenies show that hagfish chromosomes are typically fusions of multiple lamprey chromosomes. Lines connect orthologous genes and are coloured according to the ancestral chordate linkage groups (colour legend in c). Source Data
Fig. 2. History of genome duplications in vertebrates.
a, Probabilistic inference of polyploidization events in early vertebrate evolution on the basis of gene tree–species tree reconciliation (WHALE; Extended Data Fig. 4, Supplementary Table 8 and Methods) supports an initial tetraploidization shared by all vertebrates (1RV), a jawed-vertebrate-specific tetraploidization (2RJV) and a cyclostome-specific polyploidization (2RCY). Supported polyploidization events (Bayes factors BFNull_vs_WGD < 10−3) are shown in colour (1RV, 2RJV and 2RCY) and non-supported ones in grey (2RV, hagfish-specific, lamprey-specific). The WHALE method cannot distinguish between tetraploidization and hexaploidization events. b, Paralogon-based polyploidization inference using molecular phylogenies reconstructed for each of the 17 informative CLGs (Supplementary Fig. 1). Successive polyploidization events during vertebrate evolution are shown as coloured polygons and the proportion of CLG trees displaying these duplication nodes is indicated below. c, Sample paralogon tree for CLGJ. As for gene trees, in paralogon trees some nodes correspond to speciation events (grey) and others to duplication events (coloured); both types of events can be dated using a molecular clock. Species and datasets used are listed in Supplementary Table 8, and dating was performed with PhyloBayes (Methods) using fossil calibrations reported in Supplementary Table 7. d, Molecular dating of the polyploidizations and speciation events in early vertebrate evolution. Divergence times are indicated for speciation (grey) and duplication nodes (coloured as in a) are indicated. In c,d, each node is labelled with the mean divergence time across CLGs. Ediac., Ediacaran; Cambr., Cambrian; Ord., Ordovician; Sil., Silurian; Devon., Devonian; Carbon., Carboniferous; Perm., Permian; Trias., Triassic. Source Data
Fig. 3. Limited lineage-specific rediploidization after vertebrate genome duplications.
a, Gene-tree topologies expected under the ancestral rediploidization (left) and lineage-specific rediploidization (right) models after the 1RV (Methods and Extended Data Fig. 6). In the ancestral rediploidization scenario, paralogous gene sequences diverge before the cyclostome–gnathostome split and thus group by duplicated gene copy. In the lineage-specific rediploidization scenario, paralogue sequences diverge independently in the stem gnathostome and cyclostome lineages, and thus genes are grouped by lineage. b, Number of significantly supported gene trees in favour of ancestral and lineage-specific rediploidization scenarios after 1RV, for each of 17 informative ancestral linkage groups (CLGs). c, Tree topologies expected under the ancestral and lineage-specific rediploidization models after 2RCY. The CLGB paralogon tree shows an ancestral rediploidization topology for 1RV copy 2, but lineage-specific rediploidization for 1RV copy 1, where two hagfish (chr. 4 and chr. 5) and two lamprey (chr. 10 and chr. 2) paralogons independently rediploidized. Myr, million years. d, Evolutionary history of vertebrate Hox gene clusters resolved by the CLGB paralogon phylogeny (see bottom of c). Source Data
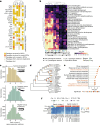
Fig. 4. Functional effects of vertebrate WGD and gene loss in vertebrates.
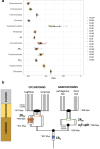
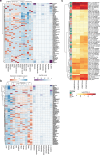
a, Key neural-crest-related gene families with members classified according to their functional role (colour) and paralogy status relative to 1RV and 2RJV. The involvement of paralogues derived from both copies of the 1RV in NCC-related function, in both gnathostomes and lampreys, supports the hypothesis that NCCs predate 1RV. b, Enrichment of functional annotation terms (gene ontology) in sets of genes showing a specific pattern of retention after vertebrate WGDs. Each column corresponds to a set of paralogous genes with a specific pattern of post-duplication retention in a given species. We distinguished cases in which both paralogues can be assigned to a specific duplication and are retained, cases in which at least one of the paralogues is retained and cases in which at least one of the two copies is lost. CNS, central nervous system. c, Distribution of the difference of positive organ-specific expression domains between selected vertebrate species and the amphioxus outgroup for ohnologue gene families. A shift to the left in the distribution (as seen for the gar) indicates an extensive subfunctionalization through the restriction of gene-expression domains in vertebrates. d, Gene-family loss in deuterostomes, highlighting the severe loss in the hagfish lineage relative to that seen in other vertebrates and deuterostomes (grey). Species abbreviations are provided in Supplementary Table 8. e, Functional enrichment (gene ontology) for gene families lost in the hagfish lineages, highlighting a simplification of visual and hormonal systems (labels in orange). f, Structure of the two clusters of α-keratin genes on chromosomes 14 and 4, and their expression in the slime gland and the skin shown as a heat map (gene expression expressed as fragments per kilobase per million reads (FPKM)). Unchar is the prefix used for naming genes that did not receive a gene name by homology search. Genes are shown in the same order in the heat map as they are located in the two clusters. Stars indicate the two genes that are expressed preferentially in the skin (Extended Data Fig. 10).
Fig. 5. Germline-specific and enriched sequences and genes in hagfish.
a, Plot showing the degree of germline enrichment and estimated span of all predicted repetitive elements in the E. atami genome, focusing on elements with a cumulative span of less than 4 Mb (per family member). Previously identified elements, are highlighted by coloured circles and newly identified high-copy elements are highlighted by coloured diamonds. Additional higher copy repeats are visible in Extended Data Fig. 12m,n. The colouring scheme is the same in b and in Extended Data Fig. 12m,n. b, Estimated cumulative span of the eight most highly abundant repeats shown as the percentage of the genome covered. c, Fluorescence in situ hybridization (FISH) of high-copy germline-specific repeats to a testes metaphase plate showing their distinct spatial clustering within chromosomes (blue counterstaining is NucBlue: Hoechst 33342; individual pairs of probes are shown in Extended Data Fig. 12m,n). d, Comparison of the sequence depth of DNA extracted from germline (testes) versus somatic (blood) tissues identifies a large number of genomic intervals with evidence for strong enrichment in the germline. The bin representing no enrichment contains a total of 2.3 Gb of the assembly. e, Genes encoded within germline-specific regions are enriched for several ontology terms related to regulation of cell cycle and cell motility (Panther Biological Processes: most specific subclass shown; Supplementary Table 14).
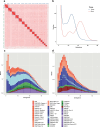
Extended Data Fig. 1. Genome content and architecture of E. atami.
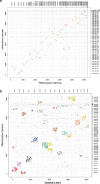
a, Hi-C contact map visualizing the density of interactions between binned genomic regions in the proximity ligation data. The high contact regions are consistent with the 17 somatic chromosomes. b, Density of 21-mer of increasing multiplicity in the somatic (blood) and germline (testes) shotgun sequence data indicated an estimated genome sizes of 2.02 and 3.28 Gb, respectively. c,d, Repeat landscape summarizing the fraction of regions diverging from consensus repeats at varying levels of divergence (Kimura 2-parameter distance) in lampreys (c) and hagfish (d). Lamprey and hagfish show a markedly different profile with respect to the number and diversity of repetitive element classes.
Extended Data Fig. 2. Phylogenetic reconstruction of deuterostome relationships with a focus on cyclostome position.
a, Tree reconstructed with IQ-TREE assuming LG4X model using a dataset of 1,467 single-copy orthologues and a partitioned model. b, Tree reconstructed using PhyloBayes and a CAT+GTR+G4 model using a subset of 176 orthologues showing the lowest saturation (see methods). c, Tree reconstructed using the same set of orthologues after Dayhoff 6 categories amino acid recoding to account for possible compositional heterogeneity due to high GC% in cyclostome genomes. d, _z_-score of posterior predictive analyses to assess composition heterogeneity. Positive _z_-scores indicate that average amino acid diversity is underestimated (negative z-scores indicate an overestimation) which highlights the composition bias existing in some lamprey and hagfish species and shows that recoding (Dayhoff 6) alleviates these biases.
Extended Data Fig. 3. Comparison of the chromosomal architectures of cyclostome genomes.
a, Comparison between two lampreys (Lethenteron reissneri and P. marinus) highlighting the conservation of both chromosomal identity and extensive collinear segments. b, Comparison between the hagfish E. atami and the lamprey P. marinus. In both panels, dots show the relative location of orthologous genes between two species, coloured if the chromosome:chromosome enrichment is significant by Fisher’s exact test (Methods); others shown in grey. The colours in a and b are based on P. marinus and E. atami chromosomes, respectively. In b, P. marinus chromosomes are sorted to aid in visualizing many-to-one mappings shown in Fig. 1d.
Extended Data Fig. 4. Tests of genome duplication hypotheses on the vertebrate tree.
a, Species phylogeny and polyploidization hypotheses tested with WHALE using 8,931 gene families (Methods, see Supplementary Table 8 for details of the genomes used in the analysis). Polyploidization hypotheses are indicated by circles on the corresponding branches, with supported polyploidizations indicated with solid circles. Inferred background gene duplication and loss rates are presented on the branches. b, Posterior distribution obtained for the WHALE post-duplication retention parameter q, for each hypothesis presented in a. Stars indicate distributions significantly different from 0 (Bayes factors BFNull_vs_WGD < 10−3), which correspond to the supported polyploidization events. c, Alternative set of polyploidization hypotheses tested, as in a, but with two successive duplications proposed in the ancestral vertebrate lineage (1RV and 2RV). d, Posterior distribution obtained for the WHALE post-duplication retention parameter, for each hypothesis presented in c. Here, the posterior distribution for retention parameters of the 1RV and 2RV events are bimodal, suggesting that the method cannot effectively separate parameters estimated for 1RV and 2RV when starting from identical priors. e, Use of distinct priors on 1RV (Beta(8, 2)) and 2RV (Beta(2, 8)) separates the estimated posterior distribution into distinct unimodal posterior distributions and provides support for a single shared 1Rv event in the vertebrate stem lineage. This analysis was performed on a random subset of 1,000 gene families, to reduce computational time (Methods).
Extended Data Fig. 5. Timescale of vertebrate genome evolution.
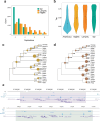
a. Distributions of timings for speciation and duplication events derived from paralogon phylogenies, showing details of the distributions indicated in Fig. 3c. b. Scenario for genome duplication and speciation events during early vertebrate evolution. Filled black circles or ovals mark speciation events; horizontal rectangles indicate presumptive auto-tetraploidies; starbursts indicate allo-polyploidies arising from hybridization of distinct progenitors (for example, alpha–beta in gnathostomes). Timings are based on a. Note that although speciation times (for example, the split between gnathostome progenitors alpha and beta, divergence of lamprey and hagfish lineages) can be estimated from gene or paralogon trees, hybridization times (for example, 2RJV, shown as green starburst) cannot be estimated from gene-tree analysis. Similarly, homoeologous recombination after auto-tetraploidization implies that the auto-tetraploidization event itself cannot be timed, but only the cessation of homoeologous recombination. Thus, the estimate of around 527 Ma for 1RV (horizontal blue rectangle) represents the cessation of recombination after this presumptive auto-tetraploidy (open rectangle on vertebrate stem) with homologous recombination represented by blue shading. The absolute timing of 1RV itself is unknown. (Auto-tetraploidy is suggested by the lack of differential gene loss between the two paralogous branches after 1R, as noted previously.) The rough estimate of a 10-million-year interval between the alpha–beta split and 2RJV allo-tetraploidy is based on analogy with recent vertebrate allo-tetraploidies in frogs and goldfish. Cyclostome hexaploidization 2RCY is shown as a two-step process culminating in the hybridization of diploid and tetraploid stem cyclostomes (orange starburst). This scenario follows the recent model of hexaploidy in sturgeon in which auto-tetraploids and diploid species coexist and hybridize. In this scenario, the earliest divergences among cyclostome paralogues occurs around 511 Ma when the diploid and future tetraploid lineages split, which could be coincident with the early tetraploidization itself. Homoeologous recombination (shown as orange shading) is largely complete by around 493 Ma, defining a second peak in paralogue divergence (horizontal orange rectangle). Not shown is ongoing homoeologous recombination in CLGB which continues into the stem hagfish and lamprey lineages, as discussed further in the main text.
Extended Data Fig. 6. Method for construction of post-1R ancestral rediploidization constrained gene-tree topologies, using CLGM as an example.
a, Gnathostome 1R 1 and 1R 2 copies can be confidently identified and serve as a skeleton to build ancestral rediploidization tree topologies (blue-purple groups). Hagfish and lamprey chromosomes confidently grouped in a clade from the CLGM paralogon tree are defined as potential 1R-derived paralogons (yellow-orange groups) and kept together in the constrained ancestral rediploidization tree topology (see b). All sets of cyclostome chromosomes that were kept together for other CLGs are indicated in Supplementary Table 5. b, Possible groupings of hagfish and lamprey genes with gnathostome genes based on their chromosomal location, following 1R ancestral rediploidization. c. Genes located on hagfish and lamprey chromosomes that are not considered in the reconstructed paralogon tree (due to low representation because of small-scale rearrangements displacing them on different chromosomes) can each be placed on either side of the duplication in the absence of any prior information. In the presented scenario, this results in six different possible ancestral rediploidization (i to vi) constrained tree topologies. Only topologies with a maximum of three lamprey genes and three hagfish genes on each side of the 1R are permitted, to remove possibly confounding effects of complex multicopy gene families.
Extended Data Fig. 7. Orthologue retention rates after 2RCY.
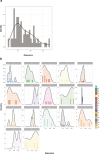
Retention is computed for each P. marinus chromosomal segment derived from a single CLG as the fraction of orthologues maintained on the segment in a comparison with the total number of orthologues for the same CLG in Branchiostoma floridae. a, Distribution of retention rates plotted for all CLGs. b, Distribution of retention rates plotted for each CLG. These distributions are not distinctly bimodal, in contrast to the finding for 2RJV. Lamprey is used because it more closely preserves ancestral cyclostome state, as proposed previously.
Extended Data Fig. 8. Phylogeny of the Hox clusters on the basis of a concatenation of Hox genes and bystanders.
Left, phylogeny of the Hox clusters, with node bootstrap support. One-to-one orthologies for gnathostome clusters are well-supported, similarly for cyclostome clusters with the exception of hagfish V-I and lamprey β-ε. Dark grey boxes highlight cyclostomes clusters that are expected to be orthologous to gnathostome clusters A/B based on chromosomal orthology (Fig. 3d), similarly light grey boxes are for expected orthologs to gnathostome clusters C/D. Right, schematic representation of cyclostome and gnathostome Hox clusters. Hox genes are shown as yellow boxes, 5’ bystanders as red boxes and 3’ bystanders as blue boxes. The order of genes reflects the actual arrangement of genes in each species.
Extended Data Fig. 9. Evolution of duplicated genes and gene families in hagfish.
a, Counts of gene families containing the specified number of retained paralogues in gar, lamprey (P. marinus) and hagfish (E. atami). b, Comparison of the tissue-specificity of gene expression (tau index) for ohnologue gene families in lampreys, hagfish, gar and the (unduplicated) amphioxus outgroup (Methods). The distribution of the maximal tau value for each gene family is shown. c, Node-specific gene loss events inferred by GeneRax in a species–gene tree reconciliation framework (Methods). Species labels are specified in Supplementary Table 8. d, Loss of Panther families across deuterostomes species inferred as the most parsimonious events from gene-family composition. e, Genome structure of the two clusters of expanded keratin genes, with mRNA expression in slime gland and skin (blue track).
Extended Data Fig. 10. Gene expression and gene duplications in vertebrates.
a,b, Weighted gene co-expression network analysis (WGCNA) among organs for hagfish (a) and gar (b). Each row corresponds to a WGCNA cluster (with an arbitrary colour name) and its expression specificity is shown in selected tissues on the left (a, hagfish, b, gar). The enrichment of gene duplicated at successive phylogenetic nodes in each WGCNA cluster is indicated on the right as the p-value (-log10) of hypergeometric tests. A significant enrichment is observed in gene with strong neural expression (brain, blue cluster). c, Expression of selected paralogues involved in neural crest specification and migration in cranial and trunk neural crest tissues from lamprey P. marinus. RNA-seq data from a previous study was quantified using the latest version of the lamprey genome and RefSeq annotation (kPetMar1). For each gene family, all paralogues derived from the vertebrate polyploidization event (1RV and 2RCY) are considered and classified (see Supplementary Tables 9 and 10). As denoted in inset, 1 (green cells) and 2 (pink cells) refer to the two original paralog branches derived from 1RV (see main Fig. 4a). Grey groups could not be definitively assigned.
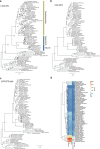
Extended Data Fig. 11. Eliminated genes and repeats identified in the hagfish genome.
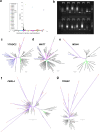
a, Plot showing the degree of germline enrichment and estimated span of all predicted repetitive elements. Previously identified elements, are highlighted by coloured circles and new high-copy elements are highlighted by coloured diamonds. b, PCR validation illustrating germline enrichment and tandem repetition of predicted satellite elements. g: germline (testes) DNA used as template, s: somatic (blood) DNA used as template. c–e, Gene trees for homologues that are eliminated in both lamprey and hagfish. Gnathostome clades are highlighted in shades of green and cyclostome clades are highlighted in shades of purple. Individual germline-specific genes are highlighted in red (hagfish) or blue (lamprey). c, Tree for YTHCD2 homologues. d, Tree for WNT7 homologues. e, Tree for MSH4 homologues. f,g, Gene trees for homologues that are highly duplicated in hagfish. Gnathostome clades are highlighted in shades of green and cyclostome clades are highlighted in shades of purple. Individual germline-specific genes are highlighted in red. f, Tree for FBXL4 homologues. g, Tree for TRRAP homologues.
Extended Data Fig. 12. FISH of repeats to germline and somatic interphase nuclei.
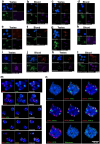
Nuclei are labelled with the DNA stain NucBlue (blue) and for all panels labelled “no signal” fluorescence images are overexposed to both show background signal and aid in confirming the location of nuclei in those images. a,b, Germline enriched EEPs2 (red) and HFR10 (magenta), and the somatic repeat EEPs1 (green) are hybridized to nuclei isolated from a, germline: testes and b, soma: blood. c,d, Germline enriched repeats EEPs4 (red) and HFR5 (green), and the somatic repeat Soma3 (magenta) are hybridized to nuclei isolated from c, germline: testes and d, soma: blood. e,f, Germline enriched repeats HFR13 (magenta) and HFR6 (green), and the somatic repeat Soma1 (red) are hybridized to nuclei isolated from e, germline: testes and f, soma: blood. g,h, Germline enriched repeats EEEo2 (red) and HFR16 (magenta), and the somatic repeat EEPs1 (green) are hybridized to nuclei isolated from g, germline: testes and h, soma: blood. i,j, Germline enriched repeats HFR4 (red) and HFR8 (green), and the somatic repeat Soma3.1 (magenta) are hybridized to nuclei isolated from i, germline: testes and j, soma: blood. k,l, Germline enriched repeats EEPs2 (red) and EEPs3 (green), and the somatic repeat Soma3 (magenta) are hybridized to nuclei isolated from k, germline: testes and l, soma: blood. m,n, In situ Hybridization of probes for ten germline-enriched satellite sequences. m, Probes are hybridized to germline interphase nuclei. n, Probes are hybridized to germline interphase nuclei. The location of hybridization signals for telomere probes and approximate bounds of 18 germline-specific dyads, corresponding to nine distinct germline-specific chromosomes. For all images, pairs of repeats are shown to aid in visualizing the relative location of individual probes.
Update of
- The hagfish genome and the evolution of vertebrates.
Marlétaz F, Timoshevskaya N, Timoshevskiy V, Simakov O, Parey E, Gavriouchkina D, Suzuki M, Kubokawa K, Brenner S, Smith J, Rokhsar DS. Marlétaz F, et al. bioRxiv [Preprint]. 2023 Apr 18:2023.04.17.537254. doi: 10.1101/2023.04.17.537254. bioRxiv. 2023. PMID: 37131617 Free PMC article. Updated. Preprint.
Similar articles
- The hagfish genome and the evolution of vertebrates.
Marlétaz F, Timoshevskaya N, Timoshevskiy V, Simakov O, Parey E, Gavriouchkina D, Suzuki M, Kubokawa K, Brenner S, Smith J, Rokhsar DS. Marlétaz F, et al. bioRxiv [Preprint]. 2023 Apr 18:2023.04.17.537254. doi: 10.1101/2023.04.17.537254. bioRxiv. 2023. PMID: 37131617 Free PMC article. Updated. Preprint. - Hagfish genome elucidates vertebrate whole-genome duplication events and their evolutionary consequences.
Yu D, Ren Y, Uesaka M, Beavan AJS, Muffato M, Shen J, Li Y, Sato I, Wan W, Clark JW, Keating JN, Carlisle EM, Dearden RP, Giles S, Randle E, Sansom RS, Feuda R, Fleming JF, Sugahara F, Cummins C, Patricio M, Akanni W, D'Aniello S, Bertolucci C, Irie N, Alev C, Sheng G, de Mendoza A, Maeso I, Irimia M, Fromm B, Peterson KJ, Das S, Hirano M, Rast JP, Cooper MD, Paps J, Pisani D, Kuratani S, Martin FJ, Wang W, Donoghue PCJ, Zhang YE, Pascual-Anaya J. Yu D, et al. Nat Ecol Evol. 2024 Mar;8(3):519-535. doi: 10.1038/s41559-023-02299-z. Epub 2024 Jan 12. Nat Ecol Evol. 2024. PMID: 38216617 Free PMC article. - Genome biology of the cyclostomes and insights into the evolutionary biology of vertebrate genomes.
Smith JJ, Saha NR, Amemiya CT. Smith JJ, et al. Integr Comp Biol. 2010 Jul;50(1):130-7. doi: 10.1093/icb/icq023. Epub 2010 Apr 19. Integr Comp Biol. 2010. PMID: 21558194 Free PMC article. - Impact of asymmetric gene repertoire between cyclostomes and gnathostomes.
Kuraku S. Kuraku S. Semin Cell Dev Biol. 2013 Feb;24(2):119-27. doi: 10.1016/j.semcdb.2012.12.009. Epub 2013 Jan 3. Semin Cell Dev Biol. 2013. PMID: 23291292 Review. - Palaeophylogenomics of the vertebrate ancestor--impact of hidden paralogy on hagfish and lamprey gene phylogeny.
Kuraku S. Kuraku S. Integr Comp Biol. 2010 Jul;50(1):124-9. doi: 10.1093/icb/icq044. Epub 2010 May 14. Integr Comp Biol. 2010. PMID: 21558193 Review.
Cited by
- Understanding vertebrate immunity through comparative immunology.
Boehm T. Boehm T. Nat Rev Immunol. 2024 Sep 24. doi: 10.1038/s41577-024-01083-9. Online ahead of print. Nat Rev Immunol. 2024. PMID: 39317775 Review. - Evolutionary origins and innovations sculpting the mammalian PRPS enzyme complex.
Karki BR, Macmillan AC, Vicente-Muñoz S, Greis KD, Romick LE, Cunningham JT. Karki BR, et al. bioRxiv [Preprint]. 2024 Oct 1:2024.10.01.616059. doi: 10.1101/2024.10.01.616059. bioRxiv. 2024. PMID: 39411161 Free PMC article. Preprint. - Three foxg1 paralogues in lampreys and gnathostomes-brothers or cousins?
Ermakova GV, Kucheryavyy AV, Mugue NS, Mischenko AV, Zaraisky AG, Bayramov AV. Ermakova GV, et al. Front Cell Dev Biol. 2024 Jan 2;11:1321317. doi: 10.3389/fcell.2023.1321317. eCollection 2023. Front Cell Dev Biol. 2024. PMID: 38229883 Free PMC article. - Extensive DNA methylome rearrangement during early lamprey embryogenesis.
Angeloni A, Fissette S, Kaya D, Hammond JM, Gamaarachchi H, Deveson IW, Klose RJ, Li W, Zhang X, Bogdanovic O. Angeloni A, et al. Nat Commun. 2024 Mar 4;15(1):1977. doi: 10.1038/s41467-024-46085-2. Nat Commun. 2024. PMID: 38438347 Free PMC article. - LukProt: A Database of Eukaryotic Predicted Proteins Designed for Investigations of Animal Origins.
Sobala ŁF. Sobala ŁF. Genome Biol Evol. 2024 Nov 1;16(11):evae231. doi: 10.1093/gbe/evae231. Genome Biol Evol. 2024. PMID: 39431411 Free PMC article.
References
- Ohno, S. Evolution by Gene Duplication (Springer, 1970).
- Holland PW, Garcia-Fernàndez J, Williams NA, Sidow A. Gene duplications and the origins of vertebrate development. Dev. Suppl. 1994;1994:125–133. - PubMed
MeSH terms
LinkOut - more resources
Full Text Sources
Research Materials
