Transgenic mice harboring SV40 T-antigen genes develop characteristic brain tumors - PubMed (original) (raw)
Transgenic mice harboring SV40 T-antigen genes develop characteristic brain tumors
R L Brinster et al. Cell. 1984 Jun.
Abstract
A high percentage of transgenic mice developing from eggs microinjected with plasmids containing the SV40 early region genes and a metallothionein fusion gene develop tumors within the choroid plexus. A line of mice has been established in which nearly every affected animal succumbs to this brain tumor. Thymic hypertrophy and kidney pathology are also observed in some mice. SV40 T-antigen mRNA and protein are readily detected in affected tissues; however, SV40 T-antigen gene expression is barely detectable in unaffected tissues or in susceptible tissues prior to overt pathology, suggesting that tumorigenesis depends upon activation of the SV40 genes. Comparison of DNA from tumor tissue (or cell lines derived from tumors) with DNA from unaffected tissues reveals structural rearrangements as well as changes in DNA methylation of the foreign DNA. The SV40 genes are frequently amplified in tumor tissue, which further indicates that their expression is intimately involved in tumorigenesis in transgenic mice.
Figures
Figure 1. Map of Plasmids pSV-MK and pSV-MGH
Plasmid pSV-MK consists of the T-antigen gene from SV40 (Kpn I–Bam HI fragment) and a metallothionein–thymidine kinase fusion gene (Kpn I–Bam HI) cloned into the Bam HI site of pBXΔ, which is a derivative of pBR322 that deletes the Sal I to Pvu II region and has an Xho I linker inserted at about 3000 on the pBR322 map. The SV40 T-antigen gene was isolated from pSV3-ts58, which was obtained from R. Mulligan. The metallothionein–thymidine kinase fusion gene was created by substituting the Bgl II–Sst II fragment of HSV thymidine kinase gene for the comparable fragment of the mouse MT-I gene. The location of restriction sites used in this study is indicated; the solid circles indicate the position of Hpa II sites, and the open circles indicate the position of Hha I sites in the MT-I promoter and closest adjacent sites—there are about 30 additional Hpa II and Hha I sites in the TK and pBX regions and no sites in SV40. The polyadenylated primary transcripts from these genes are shown as solid arrows; the stippled regions represent MT-I gene sequences; pBR sequences are shown as a single line with the site of deletion indicated by Δ. This plasmid is 8.8 kb. pSV-MGH is similar to pSV-MK except that the Bam HI–Eco RI fragment of the human growth hormone gene is substituted for the Bgl II–Eco RI fragment of pSV-MK; the size is 8.4 kb.
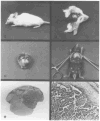
Figure 2. Pathology Associated with Expression of SV40 Early Region in Mice
(a) Photograph of mouse 427-4-2 (see Figure 3) showing the bulged cranium characteristic of brain tumor development. (b) The skin of 427-4-2 is reflected from the dorsal surface of the head to expose the separation of the cranial bones and hemorrhagic suture lines indicated by the arrow. (c) Brain of 427-4-2 showing extensive hemorrhages on the cerebral surface and a large tumor (arrow) in the right ventral cerebellum. (d) Thoracic cavity of an offspring of mouse 340 has been opened to reveal the enormous thymus. This mouse had difficulty breathing as well as a brain tumor. (e) A transverse section (stained with hematoxilin and eosin) through the cerebellar tumor area shown in (c). Note the distortion of normal cerebellar architecture and the apparent origin of the tumor from the choroid plexus of the IV ventricle. The arrow indicates the area from which the higher magnification shown in (f) was taken. (f) Photomicrograph showing tumor tissue in the center and lower left and compressed cerebellar tissue in the upper right. The arrow points to a typical papillary structure that is characteristic of these choroid plexus tumors. Magnification: 100X.
Figure 3. Inheritance of Brain Tumors in Descendants of Transgenic Mouse 427
This pedigree is designated 427; the second number indicates the generation and the last number represents the individual mouse; males are shown as boxes, females as circles; solid symbols signify the inheritance of SV-MK DNA (as determined by dot hybridization). For example, 427-2-1 is an SV-MK-positive male number 1 from the second generation of the 427 pedigree. s, signifies that the mouse was sacrificed while apparently healthy; †, signifies that the animal died with a brain tumor (bulged cranium or histological diagnosis); d, signifies that the mouse died without signs of pathology. The mean age (± SEM) at the time of death of those animals that developed tumors was 155 days (G0); 165 days (G1); 153 ± 11.3 days (G2); 152 ± 8.5 days (G3). Some of the mice shown on the bottom line of pedigree were just approaching the critical age for tumor development when this pedigree was drawn; mice 427-3-48 to 427-3-59 subsequently died of brain tumors. Most males in this pedigree are infertile.
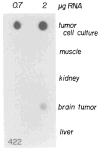
Figure 4. Dot Hybridization of SV40 Early Region RNA in Tissues of Mouse 422
Total RNA was isolated from the brain tumor and various tissues of mouse 422 as well as from a tumor cell line that was established from the brain tumor of this mouse. RNA (0.7 and 2 _μ_g) was applied to a nitrocellulose filter, hybridized with 32P-labeled SV40 viral DNA (2 × 10⁸ cpm/_μ_g), and washed, and then an autoradiograph of the filter was produced as described in Experimental Procedures.
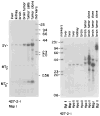
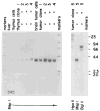
Figure 5. Detection of SV40 Large T Antigen in Tissues from Mouse 422
SV40 large T antigen was immunoprecipitated from soluble protein extracts from tissues of mouse 422 or a cell line isolated from the brain tumor. The immunoprecipitates were subjected to SDS-polyacrylamide gel electrophoresis; T antigen was detected by binding a specific antibody and 125I-protein A using a Western blot procedure as described in Experimental Procedures. Lanes 1, 2, and 3 contain SV40 large T antigen immunoselected from 0.5, 1.0, and 2.5 × 10⁶ cells, respectively, of a clonal line of cells derived from the 422 brain tumor. In the other lanes, the samples labeled “a” are from tissues of a normal mouse and samples labeled “b” are from mouse 422. The autoradiogram shown in A is a 1 day exposure, while the autoradiogram shown in B is a 2 week exposure of the same filter.
Figure 6. Southern Blot Comparing DNA from Brain Tumor Cells and Skeletal Muscle of Mouse 422
Brain tumor cells were passaged in cell culture for 5 weeks and then DNA was isolated for comparison with DNA isolated from skeletal muscle of the same animal. DNA (5 _μ_g) from tumor cells (a) and muscle (b) was digested with enzymes sensitive to DNA methylation (Sma I, Sst II, Xho I, Hha I, Hpa II) or with enzymes insensitive to DNA methylation (Eco RI, Pvu II, Msp I), electrophoresed on a 1% agarose gel, transferred to nitrocellulose, and hybridized with nick-translated SV40. The sizes of λ markers are indicated.
Figure 7. Southern Blots Showing Amplification and Methylation of SV-MK DNA in the Primary Brain Tumor and Brain Tumor Cell Lines of Mouse 427-2-1 Compared to “Normal” Tissues
(A) DNA (5 _μ_g) from liver, brain, primary brain tumor, a mixed brain tumor cell population, and a brain tumor cell clone selected in soft agar was digested with Msp I, electrophoresed on a 1.5% agarose gel, transferred to nitrocellulose, and hybridized with nick-translated SV40 and then with nick-translated Kpn I-Bgl II fragment corresponding to the MT-I promoter region. The band labeled SV corresponds to the entire T-antigen gene of SV-MK as detected with the SV40 probe; the band labeled MTb corresponds to the 260 bp fragment located between two black circles in the MT-I promoter (see Figure 1); the band labeled MTa corresponds to endogenous MT-I gene. (B) DNA (5 _μ_g) from “normal” tissues and tumor tissue or cells was digested with the indicated enzymes, electrophoresed on a 1% agarose gel, transferred to nitrocellulose, and hybridized with nick-translated SV40 viral DNA. The sizes (in kilobases) of λ Hind III markers are indicated.
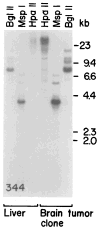
Figure 8. Southern Blot Showing Amplification and Methylation of SV-MGH DNA in a Brain Tumor Clone Derived from Mouse 344
A brain tumor clone was selected in soft agar and then expanded in normal media. DNA (5 _μ_g) from this clone and the liver of mouse 344 were digested with the indicated enzymes, electrophoresed on a 1% agarose gel, transferred to nitrocellulose, and hybridized with nick-translated SV40 viral DNA. The sizes of λ markers are indicated.
Figure 9. Southern Blot Showing Amplification of the SV-MGH Sequences in Cell Lines Derived from the Brain Tumor and Hypertrophied Thymus of Mouse 345
DNA was isolated from liver, cultured thymus cells, cultured brain tumor cells, and several clones of thymus or brain tumor cells that were selected in soft agar. DNA (5 _μ_g) was digested with Msp I, Hpa II, or Bgl II, electrophoresed on a 1% agarose gel, transferred to nitrocellulose, and hybridized with nick-translated SV40 probe. The sizes (in kilobases) of end-labeled λ Hind III markers are indicated.
Similar articles
- SV40 enhancer and large-T antigen are instrumental in development of choroid plexus tumours in transgenic mice.
Palmiter RD, Chen HY, Messing A, Brinster RL. Palmiter RD, et al. Nature. 1985 Aug 1-7;316(6027):457-60. doi: 10.1038/316457a0. Nature. 1985. PMID: 2991771 - p53 mutations are not selected for in simian virus 40 T-antigen-induced tumors from transgenic mice.
Moore M, Teresky AK, Levine AJ, Seiberg M. Moore M, et al. J Virol. 1992 Feb;66(2):641-9. doi: 10.1128/JVI.66.2.641-649.1992. J Virol. 1992. PMID: 1370552 Free PMC article. - Stimulation of simian virus 40 late gene expression by simian virus 40 tumor antigen.
Brady J, Bolen JB, Radonovich M, Salzman N, Khoury G. Brady J, et al. Proc Natl Acad Sci U S A. 1984 Apr;81(7):2040-4. doi: 10.1073/pnas.81.7.2040. Proc Natl Acad Sci U S A. 1984. PMID: 6201850 Free PMC article. - Detection of authentic SV40 DNA sequences in human brain and bone tumours.
Butel JS, Jafar S, Stewart AR, Lednicky JA. Butel JS, et al. Dev Biol Stand. 1998;94:23-32. Dev Biol Stand. 1998. PMID: 9776222 Review. - Guide to techniques in creating transgenic mouse models using SV40 T antigen.
Maroulakou IG, Muise-Helmericks RC. Maroulakou IG, et al. Methods Mol Biol. 2001;165:269-86. doi: 10.1385/1-59259-117-5:269. Methods Mol Biol. 2001. PMID: 11217393 Review. No abstract available.
Cited by
- Expression of retroviral vectors in transgenic mice obtained by embryo infection.
Stewart CL, Schuetze S, Vanek M, Wagner EF. Stewart CL, et al. EMBO J. 1987 Feb;6(2):383-8. doi: 10.1002/j.1460-2075.1987.tb04766.x. EMBO J. 1987. PMID: 3034588 Free PMC article. - Development of anaplastic ependymoma in Rasmussen's encephalitis: review of the literature and case report.
Kumar R, Wani AA, Reddy J, Pal L, Pradhan S. Kumar R, et al. Childs Nerv Syst. 2006 Apr;22(4):416-9. doi: 10.1007/s00381-005-1170-0. Epub 2005 Jun 1. Childs Nerv Syst. 2006. PMID: 15928965 Review. - Introduction of genes into the germ line of animals.
Brinster RL, Palmiter RD. Brinster RL, et al. Harvey Lect. 1984-1985;80:1-38. Harvey Lect. 1984. PMID: 6400653 Free PMC article. Review. No abstract available. - Temporally and spatially controlled expression of transgenes in embryonic and adult tissues.
Zhang Q, Triplett AA, Harms DW, Lin WC, Creamer BA, Rizzino A, Wagner KU. Zhang Q, et al. Transgenic Res. 2010 Jun;19(3):499-509. doi: 10.1007/s11248-009-9329-1. Epub 2009 Oct 8. Transgenic Res. 2010. PMID: 19821046 Free PMC article. - A morphological analysis endocrine tumour genesis in pancreas and anterior pituitary of AVP/SV40 transgenic mice.
Rindi G, Bishop AE, Murphy D, Solcia E, Hogan B, Polak JM. Rindi G, et al. Virchows Arch A Pathol Anat Histopathol. 1988;412(3):255-66. doi: 10.1007/BF00737150. Virchows Arch A Pathol Anat Histopathol. 1988. PMID: 2829418
References
- Abramczuk J. Attempts of permanent introduction of SV40 genome into mouse gametes and early embryos. In: Nagley P, Linnane AW, Peacock WJ, Pateman JA, editors. Manipulation and Expression of Genes in Eukaryotes. New York: Academic Press; 1983. pp. 355–356.
- Bishop JM. Cellular oncogenes and retroviruses. Ann Rev Biochem. 1983;52:301–354. - PubMed
Publication types
MeSH terms
Substances
LinkOut - more resources
Full Text Sources
Other Literature Sources
Medical
Molecular Biology Databases

