Mechanism of action of troponin . tropomyosin. Inhibition of actomyosin ATPase activity without inhibition of myosin binding to actin - PubMed (original) (raw)
. 1981 Jan 25;256(2):575-8.
- PMID: 6450206
- PMCID: PMC1351010
Mechanism of action of troponin . tropomyosin. Inhibition of actomyosin ATPase activity without inhibition of myosin binding to actin
J M Chalovich et al. J Biol Chem. 1981.
Abstract
The regulation of vertebrate skeletal muscle contraction by the troponin . tropomyosin complex is generally thought to be the result of tropomyosin physically blocking the myosin binding site of actin in the absence of Ca2+. This mechanism was tested during steady state ATP hydrolysis by comparing the degree of association of myosin subfragment 1 (S-1) with the actin . troponin . tropomyosin complex in the absence and presence of Ca2+. Binding in the presence of ATP was determined by stopped flow absorbance measurements at 25 degrees C. Although the steady state ATPase rate was reduced 96% in the absence of Ca2+, the association constant of S-1 with regulated actin was virtually the same in the absence of Ca2+ (1.3 X 10(4) M-1) as in the presence of Ca2+ (2.3 X 10(4) M-1). The association constant of S-1 to regulated actin in the presence of Ca2+ was similar to the association constant of S-1 to unregulated actin. These results suggest that the troponin . tropomyosin complex does not inhibit the actin-activated ATPase activity by preventing the binding of S-1 . ATP or S-1 . ADP . Pi to actin; rather, it may act by blocking the release of Pi from the acto-S-1 . ADP . Pi complex.
Figures
Fig. 1. Final absorbance of the complex formed upon binding of S-1 to actin or regulated actin as a function of S-1 concentration
The final absorbance was measured after completion of ATP hydrolysis. Conditions: 78 μ
m
actin, 17 μ
m
native tropomyosin (where applicable), 1.0 m
m
ATP, 3.0 m
m
MgCl2, 1 m
m
EGTA, 10 m
m
imidazole, pH 7.0, 25°C. •, ▪, stopped flow measurement; ○, standard spectrophotometer measurement.
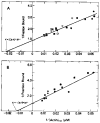
Fig. 2. Double reciprocal plots of the fraction of S-1 bound, in the presence of ATP, as a function of free actin concentration
The conditions are the same as in Fig. 1 with 20 μ
m
S-1, except where noted. A, binding in the presence of calcium. EGTA was replaced with 0.5 m
m
CaCl. Binding to regulated (closed symbols) and unregulated actin (open symbols) are shown. B, binding in the absence of calcium. S-1 concentration was varied from 10 μ
m
(▴) to 40 μ
m
(▵). In both A and B, different symbols represent different protein preparations. The solid lines are least squares fits to the data (see “Materials and Methods”).
Fig. 3. Time course of the fraction of S-1 bound to actin or regulated actin during ATP hydrolysis
Conditions are the same as in Fig. 1 with 20 μ
m
S-1 and free actin concentrations of 90 μ
m
(regulated + Ca2+), 100 μ
m
(unregulated), and 130 μ
m
(regulated + EGTA).
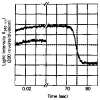
Fig. 4. Time course of the transmitted light intensity after mixing regulated actin with either S-1 (upper curve) or buffer (lower curve) in the presence of ATP and EGTA
The lower curve has been moved down about 1 V for comparison. Conditions are the same as in Fig. 1 with the following final protein concentrations: S-1, 20 μ
m
; actin, 60 μ
m
; native tropomyosin, 13 μ
m
. 35% of the S-1 was bound to actin during steady state ATP hydrolysis in this experiment.
Similar articles
- Regulation of the adenosinetriphosphatase activity of cross-linked actin-myosin subfragment 1 by troponin-tropomyosin.
King RT, Greene LE. King RT, et al. Biochemistry. 1985 Nov 19;24(24):7009-14. doi: 10.1021/bi00345a039. Biochemistry. 1985. PMID: 2934092 - Regulation of actomyosin ATPase activity by troponin-tropomyosin: effect of the binding of the myosin subfragment 1 (S-1).ATP complex.
Greene LE, Williams DL Jr, Eisenberg E. Greene LE, et al. Proc Natl Acad Sci U S A. 1987 May;84(10):3102-6. doi: 10.1073/pnas.84.10.3102. Proc Natl Acad Sci U S A. 1987. PMID: 2953023 Free PMC article. - Relationship between regulated actomyosin ATPase activity and cooperative binding of myosin to regulated actin.
Greene LE, Eisenberg E. Greene LE, et al. Cell Biophys. 1988 Jan-Jun;12:59-71. doi: 10.1007/BF02918350. Cell Biophys. 1988. PMID: 2453286 - Regulation and kinetics of the actin-myosin-ATP interaction.
Adelstein RS, Eisenberg E. Adelstein RS, et al. Annu Rev Biochem. 1980;49:921-56. doi: 10.1146/annurev.bi.49.070180.004421. Annu Rev Biochem. 1980. PMID: 6447472 Review. No abstract available.
Cited by
- Activation of skeletal S-1 ATPase activity by actin-tropomyosin-troponin. Effect of Ca++ on the fluorescence transient.
Stein LA, Chalovich JM. Stein LA, et al. Biophys J. 1991 Aug;60(2):399-407. doi: 10.1016/S0006-3495(91)82065-3. Biophys J. 1991. PMID: 1832976 Free PMC article. - X-ray diffraction studies of the structural state of crossbridges in skinned frog sartorius muscle at low ionic strength.
Xu SG, Kress M, Huxley HE. Xu SG, et al. J Muscle Res Cell Motil. 1987 Feb;8(1):39-54. doi: 10.1007/BF01767263. J Muscle Res Cell Motil. 1987. PMID: 3496357 - Tropomyosin directly modulates actomyosin mechanical performance at the level of a single actin filament.
VanBuren P, Palmiter KA, Warshaw DM. VanBuren P, et al. Proc Natl Acad Sci U S A. 1999 Oct 26;96(22):12488-93. doi: 10.1073/pnas.96.22.12488. Proc Natl Acad Sci U S A. 1999. PMID: 10535949 Free PMC article. - Regulation of contractile proteins by phosphorylation.
Adelstein RS. Adelstein RS. J Clin Invest. 1983 Dec;72(6):1863-6. doi: 10.1172/JCI111148. J Clin Invest. 1983. PMID: 6315773 Free PMC article. No abstract available. - Parallel inhibition of active force and relaxed fiber stiffness in skeletal muscle by caldesmon: implications for the pathway to force generation.
Brenner B, Yu LC, Chalovich JM. Brenner B, et al. Proc Natl Acad Sci U S A. 1991 Jul 1;88(13):5739-43. doi: 10.1073/pnas.88.13.5739. Proc Natl Acad Sci U S A. 1991. PMID: 2062853 Free PMC article.
References
- Chalovich JM, Chock PB, Eisenberg E. Fed Proc. 1980;39:1106. (abstr.)
- Huxley AF. Prog Biophys Biophys Chem. 1957;7:255–318. - PubMed
- Huxley HE. Science. 1969;164:1356–1366. - PubMed
- Perry SV. Biochem Soc Trans. 1979;7:593–617. - PubMed
MeSH terms
Substances
LinkOut - more resources
Full Text Sources
Research Materials
Miscellaneous


