Pathway of processive ATP hydrolysis by kinesin - PubMed (original) (raw)
Pathway of processive ATP hydrolysis by kinesin
S P Gilbert et al. Nature. 1995.
Abstract
Direct measurement of the kinetics of kinesin dissociation from microtubules, the release of phosphate and ADP from kinesin, and rebinding of kinesin to the microtubule have defined the mechanism for the kinesin ATPase cycle. The processivity of ATP hydrolysis is ten molecules per site at low salt concentration but is reduced to one ATP per site at higher salt concentration. Kinesin dissociates from the microtubule after ATP hydrolysis. This step is rate-limiting. The subsequent rebinding of kinesin-ADP to the microtubule is fast, so kinesin spends only a small fraction of its duty cycle in the dissociated state. These results provide an explanation for the motility differences between skeletal myosin and kinesin.
Figures
FIG. 1
Schemes 1 and 2 discussed in the text. Steady-state kinetic parameters are as follows: _k_cat=20 s−1; _K_m,ATP= 62 μM; and _K_0.5,MT=1 μM.
Scheme 1
Scheme 2
FIG. 2
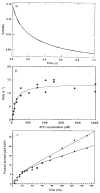
Dissociation of the M–K complex. Mg-ATP was rapidly mixed with preformed M–K401 complexes and monitored in a stopped-flow instrument to measure the rate of kinesin dissociation from the micro-tubule. a, The stopped-flow record with 1 μM K401, 0.75 μM tubulin, 1 mM Mg-ATP, and 100 mM KCI (final concentrations). The solid line is the best fit of the data to a double exponential, with _k_obs of the initial fast phase as 13.4±0.3 s−1. The slow phase observed in the absence of ATP was ignored as it was too slow to be part of the ATPase cycle and was independent of ATP concentration. b, Rate of K401 dissociation from the M–K complex (1 μM K401, 0.75 μM tubulin) as a function of Mg-ATP concentration. The solid line is the fit of the data to a hyperbola with _k_diss=13.6±0.6 s−1. c, Pre-steady-state kinetics of the M–K complex (10 μM K401, 12 μM tubulin) at 400 μM [α-32P]Mg-ATP in the presence (■) and absence (●) of 100 mM KCI. Smooth lines show the global fit of the data by computer simulation to the mechanism in scheme 1 of Fig. 1, with _K_on,ATP=0.9 μM−1 s−1; _k_off. ATP=200 s−1 and _k_hydrol=75 s−1. In the absence of added KCI, _k_ss=22 s−1, and in the presence of 100 mM KCI, _k_ss=11 s−1. The rate constant, _k_ss, represents the rate-limiting step in the pathway that limits subsequent steady-state turnovers of ATP. The linear phase of each transient represents subsequent turnover and corresponds to steady state. METHODS. K401 and tubulin were prepared as described. Micro-tubules were assembled from soluble tubulin (cold depolymerized and clarified) and stabilized with 20 μM taxol. All assays were done at 25 °C in ATPase buffer (20 mM HEPES, pH 7.2 with KOH, 5 mM magnesium acetate, 0.1 mM EDTA, 0.1 mM EGTA, 50 mM potassium acetate, 1 mM DTT), with concentrations being the final values after mixing. One syringe contained the preformed M–K401 complex (all M–K401 complexes stabilized with 10 μM taxol), and the other syringe contained Mg-ATP plus KCI. Stopped-flow experiments were performed using a KinTek StopFlow System (model SF-2001, KinTek). Turbidity was monitored at 340 nm; each trace or data point represents the average of 4–8 stopped-flow traces. The data a were fitted to a double exponential to correct for a slow change seen in the signal. The rate of the slow phase did not increase with increasing ATP concentration and was too slow to be on the pathway. In a control experiment, the M–K401 complex was rapidly mixed with buffer in the presence of 100 mM KCI. There was no fast change in turbidity. The rapid quench experiment (c) was done as described using a rapid-quench-flow instrument (model RQF-3, KinTek). The reaction was terminated by 2 M HCI, then mixed with chloroform to denature the protein and 2 M Tris–3 M NaOH to neutralize the reaction mixture. The product [α-32P]ADP was separated from [α-32P]ATP by PEI-cellulose thin-layer chromatography (elution buffer, 0.6 M potassium phosphate, pH 3.4), and radiolabelled ADP and ATP were quantified using a Betascope 603 blot analyser (Betagen). Kinetics were modelled by numerical integration using the KINSIM program.
FIG. 3
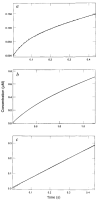
Phosphate release kinetics. Real-time kinetics of Pi release were measured directly using a fluorescent coupled assay. a, Stopped-flow trace for rapid mixing of M–K401 complex (0.05 μM K401, 0.075 μM tubulin) with 500 μM Mg-ATP plus 100 mM KCl. Data are expressed as μM Pi formed as a function of time (fluorescence signal provided 2 volts, equivalent to 1 μM Pi). The smooth line shows the fit of the data to the burst equation (y = A_1 * exp (−_k_1_t) + k_2_t + C) which gave the rate (_k_1) of Pi release during the first turnover as 13.1 ± 0.2 s−1, the amplitude of the burst (_A_1) as 0.5 μM, and the observed rate of Pi release during subsequent turnovers (_k_2) as 4.2 ± 0.02 s−1. b, Stopped-flow trace as for a but without KCl. The M–K401 complex was formed at 0.05 μM K401 and 0.075 μM tubulin with 500 μM Mg-ATP. Data were fitted to the burst equation to give an apparent burst rate of 1.8 s−1 and an amplitude of 0.25 μM (corresponding to 5 ATP per site). c, Stopped-flow trace in the absence of added KCl but with a higher concentration of microtubules. The M–K401 complex was formed at 0.05 μM K401 and 2 μM tubulin and rapidly mixed with Mg-ATP to a final concentration of 500 μM, with 50 mM potassium acetate. No burst of product formation was evident during the first turnover, and the data were fitted to a straight line with an observed rate of 13.4 ± 0.04 s−1. METHODS. The coupled assay system contained the A197C mutant of the E. coli phosphate-binding protein (PBP) covalently modified at cysteine 197 by _N_-[2-(1-maleimidyl)ethyl]-7-diethylaminocoumarin-3-carboxamide (MDCC) to produce the fluorescent reporter molecule, MDCC-PBP. The probe binds Pi rapidly (1.36 × 10⁸ M−1 s−1) and tightly (_K_d ∼ 0.1 μM), affording a 5-fold change in fluorescence. Background phosphate was removed from the buffer and solutions by the ‘Pi mop’, consisting of 7-methylguanosine (0.5 mM) and purine nucleoside phosphorylase (0.5 units per ml). Pi release from the M–K401 complex upon mixing with Mg-ATP was determined by measurement of the fluorescence change that occurred with Pi binding by MDCC-PBP (2 μM). The data, recorded as the relative fluorescence (volts), was converted to concentration (μM) based on preliminary experiments in which the MDCC-PBP was rapidly mixed with excess KH2PO4 (data not shown). Stopped-flow experiments used a Hg arc lamp, with excitation at 425 nm; emission was observed using a 450 nm cutoff long-wave pass filter. The M–K401 complex was preformed in 2 μM K401 and 3 μM tubulin and diluted to 0.05 μM K401, 0.075 μM tubulin to ensure that K401 was in a dimer state.
FIG. 4
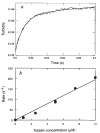
Kinetics of K · ADP binding to the microtubule. a, Stopped-flow record for an experiment in which 2 μM K401 · ADP was rapidly mixed with 5 μM tubulin. Smooth line shows the fit to an exponential followed by a linear phase with the observed exponential rate at 90 s−1. b, Microtubule concentration dependence of the rate of binding by K401. Data were fitted to a straight line; the slope gives the apparent second-order rate constant for microtubule binding (19.5 ± 0.7 μM−1 s−1).
FIG. 5
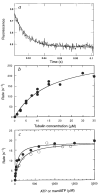
Kinetics of mantADP release from the M–K · mantADP complex. a, Representative stopped-flow record in which 2 μM K401 · mantADP was rapidly mixed with microtubules (5 μM tubulin) plus 1 mM Mg-ATP. Solid line is the best fit of the data to a single exponential with _k_obs = 67 s−1. b, The microtubule concentration dependence of the rate of mantADP release from the M–K · mantADP complex (2 μM K401 · mantADP). The fit of the data to a hyperbola gives the maximum rate of 306 ± 25 s−1. c, Steady-state ATPase (●) and mantATPase (○) of the M–K401 complex with 0.2 μM K401 and microtubules at 12 μM tubulin. Each data set was fitted to a hyperbola to determine the steady-state parameters for each substrate: for Mg-ATP _k_cat = 18.6 ± 0.6 s−1 and _K_m,ATP = 61.5 ± 8.4 μM; for Mg-mantATP, _k_cat = 19.0 ± 0.9 s−1 and _K_m,mantATP = 151 ± 30 μM. METHODS. K · mantADP was prepared by incubating K401 as purified (ADP tightly bound at the active site) with mantADP (Molecular Probes) at 25 °C with 40 μM K401 plus 40 μM Mg-mantADP for 20 min before preparing the M–K · mantADP complex (for some experiments, mantADP was in excess of K401). There was no difference in signal or observed rates with labelling 1:1 (K401:mantADP) or with mantADP in excess (labelling at 1:4). The purity of mantADP and mantATP was confirmed by thin-layer chromatography (silica gel 60, F254 in 1-propanol/NH4OH/water 6:3:1, v/v, containing 0.5 g l−1 EDTA); _N_-methylanthraniloyl derivatives had the absorption and fluorescence spectra previously described. The steady state for ATPase in c was determined as described using Mg-[α-32P]ATP. For mantATP experiments, Pi was quantified by malachite green assay.
FIG. 6
Sequential release of the kinesin heads from the microtubule. Computer modelling (KINSIM) of the kinetic data predicted the time courses shown as dimeric kinesin progresses through a complete cycle (2 ATPs hydrolysed). Curve 1 represents the species with both kinesin heads bound to the microtubule. Curve 2 shows the appearance of the intermediate that results after the first head is released, and curve 3 shows the appearance of the intermediate in which both heads are dissociated from the microtubule. Inset: simulated kinetics of the sequential release of two heads, with each species contributing equally to the signal and each step occurring at 20 s−1. Superimposed on this trace is the best fit to a single exponential giving a rate of 13.3 s−1.
Comment in
- Molecular motors. Two heads are better than one.
Schnapp BJ. Schnapp BJ. Nature. 1995 Feb 23;373(6516):655-6. doi: 10.1038/373655a0. Nature. 1995. PMID: 7854436 No abstract available.
Similar articles
- Pathway of the microtubule-kinesin ATPase.
Johnson KA, Gilbert SP. Johnson KA, et al. Biophys J. 1995 Apr;68(4 Suppl):173S-176S; discussion 176S-179S. Biophys J. 1995. PMID: 7787062 Free PMC article. - Pre-steady-state kinetics of the microtubule-kinesin ATPase.
Gilbert SP, Johnson KA. Gilbert SP, et al. Biochemistry. 1994 Feb 22;33(7):1951-60. doi: 10.1021/bi00173a044. Biochemistry. 1994. PMID: 8110800 - Pathway of ATP hydrolysis by monomeric and dimeric kinesin.
Moyer ML, Gilbert SP, Johnson KA. Moyer ML, et al. Biochemistry. 1998 Jan 20;37(3):800-13. doi: 10.1021/bi9711184. Biochemistry. 1998. PMID: 9454569 - The kinetic mechanism of kinesin.
Cross RA. Cross RA. Trends Biochem Sci. 2004 Jun;29(6):301-9. doi: 10.1016/j.tibs.2004.04.010. Trends Biochem Sci. 2004. PMID: 15276184 Review. - Kinesin and myosin ATPases: variations on a theme.
Hackney DD. Hackney DD. Philos Trans R Soc Lond B Biol Sci. 1992 Apr 29;336(1276):13-7; discussion 17-8. doi: 10.1098/rstb.1992.0038. Philos Trans R Soc Lond B Biol Sci. 1992. PMID: 1351290 Review.
Cited by
- Design strategies of fluorescent biosensors based on biological macromolecular receptors.
Tainaka K, Sakaguchi R, Hayashi H, Nakano S, Liew FF, Morii T. Tainaka K, et al. Sensors (Basel). 2010;10(2):1355-76. doi: 10.3390/s100201355. Epub 2010 Feb 12. Sensors (Basel). 2010. PMID: 22205872 Free PMC article. Review. - Dimeric Eg5 maintains processivity through alternating-site catalysis with rate-limiting ATP hydrolysis.
Krzysiak TC, Gilbert SP. Krzysiak TC, et al. J Biol Chem. 2006 Dec 22;281(51):39444-54. doi: 10.1074/jbc.M608056200. Epub 2006 Oct 23. J Biol Chem. 2006. PMID: 17062577 Free PMC article. - Microtubule-kinesin interface mutants reveal a site critical for communication.
Klumpp LM, Brendza KM, Gatial JE 3rd, Hoenger A, Saxton WM, Gilbert SP. Klumpp LM, et al. Biochemistry. 2004 Mar 16;43(10):2792-803. doi: 10.1021/bi035830e. Biochemistry. 2004. PMID: 15005614 Free PMC article. - Pathway of the microtubule-kinesin ATPase.
Johnson KA, Gilbert SP. Johnson KA, et al. Biophys J. 1995 Apr;68(4 Suppl):173S-176S; discussion 176S-179S. Biophys J. 1995. PMID: 7787062 Free PMC article. - The kinesin walk: a dynamic model with elastically coupled heads.
Derényi I, Vicsek T. Derényi I, et al. Proc Natl Acad Sci U S A. 1996 Jun 25;93(13):6775-9. doi: 10.1073/pnas.93.13.6775. Proc Natl Acad Sci U S A. 1996. PMID: 8692894 Free PMC article.
References
- Brady ST. Nature. 1985;317:73–75. - PubMed
- Scholey JM, Porter ME, Grissom PM, McIntosh JR. Nature. 1985;318:483–486. - PubMed
- Taylor EW. The Heart and Cardiovascular System. 2nd edn Raven; New York: 1992. pp. 1281–1293.
- Johnson KA. A. Rev. Biophys. biophys. Chem. 1985;14:161–188. - PubMed
Publication types
MeSH terms
Substances
LinkOut - more resources
Full Text Sources
Molecular Biology Databases


