Two distinct phases of apoptosis in mammary gland involution: proteinase-independent and -dependent pathways - PubMed (original) (raw)
Two distinct phases of apoptosis in mammary gland involution: proteinase-independent and -dependent pathways
L R Lund et al. Development. 1996 Jan.
Abstract
Postlactational involution of the mammary gland is characterized by two distinct physiological events: apoptosis of the secretory, epithelial cells undergoing programmed cell death, and proteolytic degradation of the mammary gland basement membrane. We examined the spatial and temporal patterns of apoptotic cells in relation to those of proteinases during involution of the BALB/c mouse mammary gland. Apoptosis was almost absent during lactation but became evident at day 2 of involution, when beta-casein gene expression was still high. Apoptotic cells were then seen at least up to day 8 of involution, when beta-casein gene expression was being extinguished. Expression of sulfated glycoprotein-2 (SGP-2), interleukin-1 beta converting enzyme (ICE) and tissue inhibitor of metalloproteinases-1 was upregulated at day 2, when apoptotic cells were seen initially. Expression of the matrix metalloproteinases gelatinase A and stromelysin-1 and the serine proteinase urokinase-type plasminogen activator, which was low during lactation, was strongly upregulated in parallel starting at day 4 after weaning, coinciding with start of the collapse of the lobulo-alveolar structures and the intensive tissue remodeling in involution. The major sites of mRNA synthesis for these proteinases were fibroblast-like cells in the periductal stroma and stromal cells surrounding the collapsed alveoli, suggesting that the degradative phase of involution is due to a specialized mesenchymal-epithelial interaction. To elucidate the functional role of these proteinases during involution, at the onset of weaning we treated mice systemically with the glucocorticoid hydrocortisone, which is known to inhibit mammary gland involution. Although the initial wave of apoptotic cells appeared in the lumina of the gland, the dramatic regression and tissue remodeling usually evident by day 5 was substantially inhibited by systemic treatment with hydrocortisone. mRNA and protein for gelatinase A, stromelysin-1 and uPA were weakly induced, if at all, in hydrocortisone-treated mice. Furthermore, mRNA for membrane-type matrix metalloproteinase decreased after hydrocortisone treatment and paralleled the almost complete inhibition of activation of latent gelatinase A. Concomitantly, the gland filled with an overabundance of milk. Our data support the hypothesis that there are at least two distinct phases of involution: an initial phase, characterized by induction of the apoptosis-associated genes SGP-2 and ICE and apoptosis of fully differentiated mammary epithelial cells without visible degradation of the extracellular matrix, and a second phase, characterized by extracellular matrix remodeling and altered mesenchymal-epithelial interactions, followed by apoptosis of cells that are losing differentiated functions.
Figures
Fig. 1
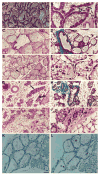
Hematoxylin-eosin and trichrome staining of lactating and involuting mouse mammary gland. (A,B) Mammary gland after 7 days of lactation. Open arrow indicates fibroblasts; solid arrow indicates myoepithelial cells. (C,D) Mammary gland after 2 days of involution. (E) Mammary gland after 3 days of involution. Arrow indicates apoptotic cells in the lumen of an alveolus shown in higher magnification in F. (G,H) Mammary gland after 4 days of involution. Straight arrow indicates a group of collapsed alveoli; curved arrow indicates adipocytes. (I,J) Mammary gland after 8 days of involution. (K,L) Staining for apoptotic cells after 3 days of involution. (K) control without and (L) with terminal deoxynucleotidyl transferase added. A,C,D,E,G,H,I, bar, 100 μm; B,F,J,K,L, bar, 25 μm. A,B,C,E,G,I,J were stained with hematoxylin and eosin; K,L were counterstained with hematoxylin; D,H were stained with trichrome.
Fig. 2
Analysis of mRNA isolated from mouse mammary gland involuting for various times. (A) RNA blot analysis for ICE, SGP-2, TIMP-1 and TIMP-2 in extracts of lactating or involuting mammary glands. The day within each stage is indicated below in arabic numerals. 20 μg of total RNA was loaded in each lane. The blots were exposed for the following times: ICE, 8 days; SGP-2, 2 days; TIMP-1, 2 days; TIMP-2, 8 days. (B) Quantification of the mRNA signals obtained for the specific proteinase inhibitor TIMP-1 and the apoptosis marker SGP-2 in A. Probed blots were scanned in a PhosphorImager. The values obtained at day 7 lactation (L7), at the start of the involution, have been set equal to 1, and the subsequent time points are indicated as -fold induction or reduction after normalization against the value obtained for the 28S RNA hybridization, in order to correct for the slight difference in loading and transfer of the various RNA samples. (C) RNA blot analysis for uPA, gelatinase A, stromelysin-1 (SL-1), MT-MMP, β-casein mRNA and 28S RNA. The blots were exposed for the following times: uPA, 3 days; gelatinase A, 2 days; stromelysin-1, 1 day; MT-MMP, 10 days; β-casein, 2 hours; 28S, 12 hours. (D) Quantification of the mRNA signals obtained for the proteinases and β-casein in C, as described above, except that the value obtained for β-casein at L7 was set to 100. Numbers on the left indicate -fold induction of the proteinases, and on the right the reduction of β-casein expression.
Fig. 3
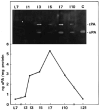
The uPA content of involuting mammary gland as determined by ELISA and fibrin zymography. Extracts were prepared from the inguinal and abdominal glands from mice that had been lactating for 7 days, followed by weaning for the indicated number of days. The concentration of uPA was determined by ELISA, and the protein concentration with the Folin-Ciocalteu reagent, as described in Materials and Methods. (Inset) Fibrin overlay zymography analysis of uPA and tPA activity in extracts of mammary glands. Tissue extracts (100 μg protein) or 5 μl rat bladder urine were subjected to SDS-polyacrylamide gel electrophoresis and zymography as described in Materials and Methods.
Fig. 4
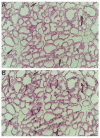
Distribution of gelatinase A and stromelysin-1 in 7-day lactating mouse mammary gland as detected by in situ hybridization. The sections were hybridized using antisense gelatinase A RNA (A) or antisense stromelysin-1 RNA (B). Straight arrows in A and B indicate ducts positive for gelatinase A and stromelysin-1, respectively. Curved arrows indicate areas shown at higher magnification in Fig. 5A,C. Bar, 100 μm.
Fig. 5
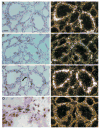
Distribution of gelatinase A, stromelysin-1 and uPA in 7-day lactating mouse mammary gland as detected by in situ hybridization. Higher magnification of the in situ hybridization shown in Fig. 4. The sections were hybridized by using antisense gelatinase A RNA (A,A*), antisense uPA (B,B*), antisense stromelysin-1 RNA (C,C*), or sense stromelysin-1 RNA (E) as described in Materials and Methods. Tissue sections were viewed by bright-field (A-D) or dark-field (A*,B*,C*,E) microscopy. Arrow in C indicates area shown at higher magnification in D. Positive control experiments were performed by application of two different antisense probes, covering nonoverlapping parts of each of the three cDNAs, as described in Materials and Methods. These probes were adjusted to the same specific activity and applied to adjacent sections of the mammary gland. In all cases, the two probes showed identical hybridization patterns for each specific mRNA (data not shown). As a negative control, sense RNA probes transcribed from each of the three cDNAs were applied to adjacent sections of all specimens, and in these sections no signal was obtained above background. In sections treated with RNase A before hybridization, no signal was detected with the antisense probes. A,A*,B,B*,C,C*,E, bar, 25 μm; D, bar, 5 μm.
Fig. 6
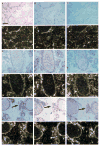
In situ hybridization for gelatinase A, stromelysin-1 and uPA mRNA in mouse mammary gland during involution. In situ hybridization analysis was performed on tissue isolated at day 3 (A-C, A*-C*), day 5 (D-F, D*-F*) or day 7 (G-I, G*-I*) after weaning. Photomicrographs of (A,D,G) gelatinase A expression; (B,E,H) stromelysin-1 expression; (C,F,I) uPA expression. Bar, 100 μm. Arrows in G-I indicate areas shown at higher magnification in Fig. 7A-C. (A-I) Bright-field microscopy; (A*-I*) dark-field microscopy.
Fig. 7
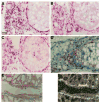
Localization of gelatinase A, stromelysin-1 and uPA mRNA in the mammary gland after 7 days of involution. A-C are higher magnifications of the in situ hybridizations shown in Fig. 6G-I for mRNA for gelatinase A (A), stromelysin-1 (B) and uPA (C). (D) In situ hybridizations for stromelysin-1 mRNA in transversal sections of day 7 involuting mammary gland, followed by trichrome staining. (E,F) In situ hybridizations for stromelysin-1 mRNA in longitudinal sections of day 7 lactating mammary gland, followed by trichrome staining in bright-field (E) or dark-field (F) microscopy. A-D, bar, 10 μm; E,F, bar, 25 μm.
Fig. 8
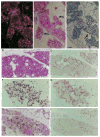
Immunohistochemical identification of cell types in involuting mammary gland. Immunohistochemical staining for macrophage-specific antigens and smooth muscle α-actin and in situ hybridization for uPA, stromelysin-1 and gelatinase A were performed as described in Materials and Methods. (A-C) In situ hybridization for uPA mRNA and immunohistochemical staining for Mac-2 antigen on day 6 of involution. Adjacent serial sections of involuting mammary gland were hybridized with an antisense uPA RNA probe (A,B) or were stained with Mac-2 antibody (C). Curved arrows in A,B show areas positive for uPA mRNA, but with no macrophage-positive cells. Straight arrows in (C) point to macrophages present, but no uPA mRNA. (D-I) In situ hybridization for uPA, gelatinase A and stromelysin-1 and immunohistochemically staining for smooth muscle α-actin antigen on day 6 of involution. Sections of involuting gland were hybridized with antisense RNA probes for uPA (D), gelatinase A (F) or stromelysin-1 (H), and adjacent sections were immunohistochemically stained for the presence of smooth muscle α-actin (E,G,I). A-E,H,I, bar, 25 μm; F,G, bar, 10 μm.
Fig. 9
Effect of systemic treatment with hydrocortisone on the involution of the mammary gland. (A,B) Histological analysis of the mammary gland after involution-inhibitory treatment. Hematoxylin and eosin staining of mammary gland involuting for 5 days after daily subcutaneous injections of saline (A) or after daily subcutaneous injections of hydrocortisone (B). Bar, 100 μm. (C) Effect of hydrocortisone treatment on gelatinase and plasminogen activator activity. Substrate zymograms for gelatinases and plasminogen activators. (Lane 1) Involuting day 5, (lane 2) involuting day 5 + hydrocortisone. +/− indicates in vitro 4-aminophenylmercuric acetate activation of the extract for 1 hour (+) or no activation (−). Samples from two different mice are shown for the plasminogen activator zymogram. The mobility of both uPA and tPA are slightly higher in substrate gels than in SDS-PAGE gels. (D) Effect of hydrocortisone treatment on specific gene expression. RNA blot analysis for gelatinase A, stromelysin-1, uPA, MT-MMP, β-casein and 28 S RNA. (Lane 1) Involuting day 5, (lane 2) involuting day 5 + hydrocortisone. After hybridization of the RNA blots with the various probes, the blots were analyzed in a PhosphorImager analyzer. After normalization to the level obtained for the 28S RNA, the value obtained at day 5 of involution without treatment was set equal to 1 for each probe, and the values after hydrocortisone treatment are indicated as -fold induction or reduction. The results shown are from a typical single experiment, which included pooled tissue extracts from at least 3 mice to reduce the effect of variability between individual mice.
Similar articles
- Coordinated expression of extracellular matrix-degrading proteinases and their inhibitors regulates mammary epithelial function during involution.
Talhouk RS, Bissell MJ, Werb Z. Talhouk RS, et al. J Cell Biol. 1992 Sep;118(5):1271-82. doi: 10.1083/jcb.118.5.1271. J Cell Biol. 1992. PMID: 1512297 Free PMC article. - Glucocorticoid and progesterone inhibit involution and programmed cell death in the mouse mammary gland.
Feng Z, Marti A, Jehn B, Altermatt HJ, Chicaiza G, Jaggi R. Feng Z, et al. J Cell Biol. 1995 Nov;131(4):1095-103. doi: 10.1083/jcb.131.4.1095. J Cell Biol. 1995. PMID: 7490285 Free PMC article. - Proteinases of the mammary gland: developmental regulation in vivo and vectorial secretion in culture.
Talhouk RS, Chin JR, Unemori EN, Werb Z, Bissell MJ. Talhouk RS, et al. Development. 1991 Jun;112(2):439-49. doi: 10.1242/dev.112.2.439. Development. 1991. PMID: 1794314 Free PMC article. - The molecular culprits underlying precocious mammary gland involution.
Sutherland KD, Lindeman GJ, Visvader JE. Sutherland KD, et al. J Mammary Gland Biol Neoplasia. 2007 Mar;12(1):15-23. doi: 10.1007/s10911-007-9034-8. J Mammary Gland Biol Neoplasia. 2007. PMID: 17323120 Review. - Transcription factor activities and gene expression during mouse mammary gland involution.
Marti A, Lazar H, Ritter P, Jaggi R. Marti A, et al. J Mammary Gland Biol Neoplasia. 1999 Apr;4(2):145-52. doi: 10.1023/a:1018721107061. J Mammary Gland Biol Neoplasia. 1999. PMID: 10426393 Review.
Cited by
- Roles of the innate immune system in mammary gland remodeling during involution.
Atabai K, Sheppard D, Werb Z. Atabai K, et al. J Mammary Gland Biol Neoplasia. 2007 Mar;12(1):37-45. doi: 10.1007/s10911-007-9036-6. J Mammary Gland Biol Neoplasia. 2007. PMID: 17286210 Free PMC article. Review. - Gene expression profiling of mammary gland development reveals putative roles for death receptors and immune mediators in post-lactational regression.
Clarkson RW, Wayland MT, Lee J, Freeman T, Watson CJ. Clarkson RW, et al. Breast Cancer Res. 2004;6(2):R92-109. doi: 10.1186/bcr754. Epub 2003 Dec 18. Breast Cancer Res. 2004. PMID: 14979921 Free PMC article. - Suppression of epithelial apoptosis and delayed mammary gland involution in mice with a conditional knockout of Stat3.
Chapman RS, Lourenco PC, Tonner E, Flint DJ, Selbert S, Takeda K, Akira S, Clarke AR, Watson CJ. Chapman RS, et al. Genes Dev. 1999 Oct 1;13(19):2604-16. doi: 10.1101/gad.13.19.2604. Genes Dev. 1999. PMID: 10521404 Free PMC article. - Of extracellular matrix, scaffolds, and signaling: tissue architecture regulates development, homeostasis, and cancer.
Nelson CM, Bissell MJ. Nelson CM, et al. Annu Rev Cell Dev Biol. 2006;22:287-309. doi: 10.1146/annurev.cellbio.22.010305.104315. Annu Rev Cell Dev Biol. 2006. PMID: 16824016 Free PMC article. Review. - Perturbation of beta1-integrin function in involuting mammary gland results in premature dedifferentiation of secretory epithelial cells.
Faraldo MM, Deugnier MA, Tlouzeau S, Thiery JP, Glukhova MA. Faraldo MM, et al. Mol Biol Cell. 2002 Oct;13(10):3521-31. doi: 10.1091/mbc.e02-02-0086. Mol Biol Cell. 2002. PMID: 12388754 Free PMC article.
References
- Alexander CM, Werb Z. Extracellular matrix degradation. In: Hay ED, editor. Cell Biology of Extracellular Matrix. 2nd. New York: Plenum; 1991. pp. 255–302.
- Andreasen PA, Kristensen P, Lund LR, Danø K. Urokinase-type plasminogen activator is increased in the involuting ventral prostate of castrated rats. Endocrinology. 1990a;126:2567–2576. - PubMed
- Andreasen PA, Georg B, Lund LR, Riccio A, Stacey SN. Plasminogen activator inhibitors: Hormonally regulated serpins. Mol Cell Endocrinol. 1990b;68:1–19. - PubMed
Publication types
MeSH terms
Substances
LinkOut - more resources
Full Text Sources
Molecular Biology Databases
Research Materials
Miscellaneous
