Study of receptor-mediated neurotoxins released by HIV-1-infected mononuclear phagocytes found in human brain - PubMed (original) (raw)
Study of receptor-mediated neurotoxins released by HIV-1-infected mononuclear phagocytes found in human brain
D Giulian et al. J Neurosci. 1996.
Abstract
Although there is growing evidence that neurotoxic molecules produced by HIV-1-infected mononuclear phagocytes damage neurons, the precise mechanisms of neuronal attack remain uncertain. One class of cytotoxin involves neuronal injury mediated via the NMDA receptor. We examined blood monocytes and brain mononuclear cells isolated at autopsy from HIV-1-infected individuals for the ability to release NMDA-like neuron-killing factors. We found that a neurotoxic amine, NTox, was produced by blood monocytes and by brain mononuclear phagocytes infected with retrovirus. In vivo injections of minute quantities of NTox produced selective damage to hippocampal pyramidal neurons. NTox can be extracted directly from brain tissues infected with HIV-1 and showed structural features similar to wasp and spider venoms. In contrast to NTox, HIV-1 infection did not increase the release of the NMDA excitotoxin quinolinic acid (QUIN) from mononuclear cells. Although we found modest elevations of QUIN in the CSF of HIV-1-infected individuals, the increases were likely attributable to entry through damaged blood-brain barrier. Taken together, our data pinpoint NTox, rather than QUIN, as a major NMDA receptor-directed toxin associated with neuro-AIDS.
Figures
Fig. 1.
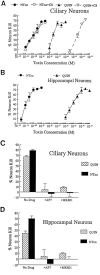
A, Dose–response curves showing relative potency of NTox and quinolinic acid (QUIN) after exposure to ciliary neuron cultures for 48 hr. NTox demonstrates greater neuron-killing capacity with ED50 values estimated in <100 p
m
. In contrast, quinolinic acid shows similar effects at ∼20 n
m
. QUIN toxicity was further affected by the presence of 10% dialyzed newborn calf serum (CS), which decreased its ED50 to ∼30 μ
m
. Similar effects were not observed for NTox. B, Dose–response curves show ∼100,000-fold difference in potency for NTox and QUIN using embryonic hippocampal neurons as targets.C, D, Both neurotoxins are inhibited in either culture system by 10 μ
m
of the NMDA receptor blockers AP7 or MK-801 (MK801). Concentrations of 1 μ
m
QUIN and 1 n
m
of NTox were used.
Fig. 2.
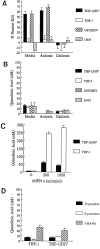
A, B, Ionic exchange chromatographic fractionation of neurotoxins found in cell culture media. Media conditioned by THP-1 or U937 cells (106 cells/ml) for 48 hr with or without HIV-1 infection were fractionated by strong anionic (DOWEX-2) or cationic (SP-Sephadex) exchangers to separate NTox from quinolinic acid. Nearly all the neurotoxic activity recovered from infected cells is NTox, which binds to the cationic exchange resin but not to the anionic exchanger. The same amounts of QUIN found in these fractions do not correlate to measured neurotoxic activity. C, THP-1 exposed to high concentrations of IFNγ to induce indoleamine 2,3-dioxygenase show production of modest levels of quinolinate, whereas cells infected with retrovirus show far less of a response. D, QUIN production by cells in the presence of 2.5 m
m
tryptophan (t = 24 hr exposure), 50 μ
m
kynurenine (t = 24 hr), or 10 μ
m
3-HANA (t = 2 hr) remains unaffected by HIV-1 infection.
Fig. 3.
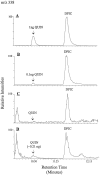
To estimate recovery of QUIN from culture media by GC/MS, 3 ml of culture media were mixed with 3, 10, 30, and 100 ng of_QUIN_ plus 100 ng dipicolinic acid (DPIC) in each sample to serve as the internal standard. After column fractionation and lyophilization, samples then received 100 ng of pyridine 2,4-dicarboxylic acid as an external standard. Both results showed good linear correlation with the actual amounts of QUIN added (correlation coefficients of 0.996 and 0.987, respectively). The percent recovery of QUIN for the entire protocol including column fractionation was estimated at 83 ± 11% (determined by dividing amounts of QUIN measured by the external standard method by those measured by the internal standard method), which was in good agreement with the 85 ± 5% recovery estimated by 3H-QUIN. A, Chromatographic separation of silylated QUIN and of DPIC from standard solutions (1 ng QUIN and 2 ng DPIC in 2 μl injected volume).B, A similar chromatogram shows the sensitivity of the GC/MS at 0.1 ng QUIN with a signal-to-noise ratio of >10. C, Control sample from 3 ml of N2 culture media with no detectable QUIN.D, N2 media conditioned by THP-1 cells infected by HIV-1 for 48 hr (106 cells/ml).
Fig. 4.
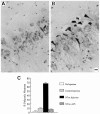
A, Blood monocytes from HIV-1-infected donors release neurotoxic factors. Photomicrographs of E18 rat hippocampal neurons (immunolabeled for neurofilament and MAP-2) show that neurons thrive in the presence of conditioned media from monocytes of normal volunteers (A; 10% by volume), whereas a significant loss of neurons occurred in cultures exposed to media from monocytes of an HIV-1-infected individual (B; Scale bar, 20 μm). C, Graph shows the dose-dependent killing of neurons by media conditioned by monocytes isolated from infected [HIV(+)] or uninfected [HIV(−)] individuals. D, Blood cells isolated from an HIV-1-infected donor show that increasing cell number increases the amount of NTox produced, but has no effect on the measured levels of QUIN. Blood cells from a normal donor [HIV(−)] have no significant neurotoxic activity. The high basal levels of QUIN found in these culture media come from the supplements (fetal bovine sera, giant cell derived growth factors) used to maintain productive HIV-1 infection among human blood cells.
Fig. 5.
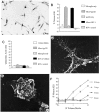
A, Photomicrograph of human microglia isolated from normal adult human brain demonstrates the presence of CD4 surface receptor by immunoperoxidase staining. CD4 receptor provides the site for HIV-1 infection of mononuclear cells. B, The neurotoxic activity of human microglia isolated from normal brain can be elicited by exposure to 1 n
m
gp120 or by_in vitro_ infection with HIV-1. The mock infection control (HIV-1 control) or gp120 alone (gp120 only) do not cause neuron damage. Fractionation by ion exchange chromatography confirmed that such neurotoxic activity is entirely attributable to NTox. C, In contrast to NTox, quinolinate acid production is not altered in human microglia by exposure to gp120 or HIV-1.D, Electron photomicrograph of scanning EM that shows a microglial cell isolated from human brains after a rapid autopsy. Human microglia are process-bearing and covered with spines (2500× magnification). E, In addition to microglia, HIV-1-infected brains also contain invading macrophages, which can be identified by ruffled surfaces (2500× magnification). F, Mononuclear phagocytes isolated from HIV-1-infected brain (106 cells/ml) show increasing amounts of neurotoxic activity over time. Under identical conditions, microglia from normal brains did not release neuron-killing factors (data not shown).
Fig. 6.
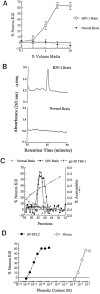
A, Characterization of neurotoxic activity found in ultrafiltrates from HIV-1-infected brain tissue. Aqueous extracts (10 vol of H20 per gram of tissue) of HIV-1-infected gray matter obtained at autopsy were separated by ultrafiltration (cutoff 1000 Da). Biological assays show that ultrafiltrates from HIV-1-infected (HIV-1 Brain), but not from normal control brains (Normal Brain), contain neurotoxic activity that destroys rat hippocampal neurons in a dose-dependent manner. B, Pooled neocortical gray matter from HIV-1-infected brain (HIV-1 Brain) or Normal Brain were processed as described in Materials and Methods using pH-dependent organic extractions, acid hydrolysis, and sequential C18 RP-HPLC. As shown here, a distinctive peak at ∼25 min retention time (UVmax of 265) is found in the HIV-1-infected, but not control, tissues. C, The UV peak shown in_B_ was fractionated further by RP-HPLC using a gradient of acetonitrile. As shown, microfractions (100 μl each) of highly purified NTox found in HIV-1-infected brain coeluted with NTox released by gp120-stimulated THP-1 cells (gp120 THP-1). No biological activity was recovered from identical fractions of normal brain.D, Dose–response curves show that the ED50 = 10 μ
m
in the ultrafiltrate (Filtrate) compared with 10 p
m
for highly purified NTox after C18 RP-HPLC. From such preparations, we estimate >100,000-fold purification. The phenolic content was estimated by UVmax at 265 nm against a standard curve of tyramine. A similar result was obtained when values were normalized to amine content measured against a tyramine curve using the fluorescamine method.
Fig. 7.
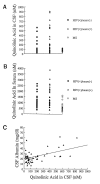
Measurement of quinolinic acid in donors with HIV-1 infection or multiple sclerosis (MS).A, Individual concentrations of QUIN found in CSF of HIV-1(+) donors with [_neuro(+)_] or without [_neuro(−)_] neurological abnormalities. As shown, higher values are noted in both categories of infected donors when compared with MS controls. Mean CSF QUIN concentrations in HIV-1 groups were 126 ± 26 n
m
for neuro(−) and 268 ± 50 n
m
for neuro(+) compared with 74 ± 6 n
m
for the MS group. B, Mean serum QUIN concentrations are higher for HIV-1-infected donors than for those measured in the MS group. [mean scores for serum QUIN were 1249 ± 170 n
m
for neuro(−); 1530 ± 180 for neuro(+); and 677 ± 90 n
m
for MS]. C, Correlation of mean CSF albumin concentration with mean QUIN concentrations found in HIV-1-infected donors. As shown, increasing amounts of QUIN correspond to increasing amounts of albumin (r = 0.722;n = 63; p < 0.0001). Such data suggest that defects in blood–brain barrier account for elevations of both QUIN and a serum protein.
Fig. 8.
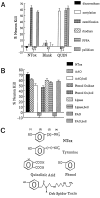
A, Chemical modifications of NTox indicate that amino groups sensitive to acetylation by acetic anhydride or derivatization by PFPA are present, whereas carboxyl groups sensitive to butanol esterification are not. Weak reduction by palladium did not alter neurotoxic activity, whereas strong reducing conditions with rhodium or methylation by diazomethane eliminated neuron killing. These data suggested the presence of double-bonded ring structures. B, Enzymatic treatments showed NTox sensitivity to polyphenol oxidase and plasma amine oxidase (PAO) but not to
l
-amino acid oxidase (AAO) or lipase. These data suggest that a phenolic ring and terminal amine are required for toxic activity. As a control, enzymatic activity was eliminated by immediate boiling (boil) to confirm specificity of action on the neurotoxin. C, Structural features of NTox. Important features that distinguish NTox from other potent neu-rotoxins include the lack of carboxyl groups (as found in quinolinic acid), the presence of amine (lacking in phenol), and the lack of peptide bonds (as found in orb spider venom). (1), Hydroxyl group on ring structure suggested by sensitivity to polyphenol oxidase and diazomethane; (2), ring structure suggested by rhodium reduction, UVmax, and polyphenol oxidase inactivation; (3), lipophilic region indicated elution with RP-HPLC and organic extractions; (4), amine group indicated by inactivation with acetylation, PFPA, and plasma amine oxidase.
Fig. 9.
A, NMDA receptor(+) ciliary neurons survive when grown in the presence of media conditioned by monocytes (10% volume) from a normal volunteer; in contrast, there is a marked loss of NMDAR1(+) neurons (B) when exposed to media from an HIV-1-infected individual. Scale bar, 7 μm. C, D, NTox interactions with the NMDA receptor. Using ultrafiltrate from HIV-infected brain, we examined its toxic effects on ciliary neurons with increasing concentrations of AP5, an NMDA receptor antagonist, or MK-801 (MK801), an NMDA channel blocker. As shown, increasing amounts of AP5 shift dose responses to the right, producing ever larger ED50 values with no change in saturating responses. Such a pattern suggests there is a direct competition between NTox and AP5 to elicit cell death. Although increasing concentrations of MK-801 block toxicity, the degree of the responses are increasingly reduced, suggesting a noncompetitive relationship between NTox and MK-801. E, A Schild analysis for AP5 curves indicates a linear relationship, again indicative of competition between neurotoxin and AP5. (The Schild analysis assumes an equilibrium is reached among agonists and receptors that might not occur in a toxicity assay with ongoing loss of cells.)
Fig. 10.
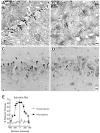
NTox infused directly into rat hippocampus kills neurons in vivo. Five days after injections, neurons most sensitive to NTox included the pyramidal cells of the CA1 and CA3 regions. A, Fink–Heimer degeneration stain of CA1 neurons after NTox infusion (purified from media conditioned by gp120-stimulated THP-1 cells). B, In contrast, contralateral hippocampus infused with a nontoxic control fraction (recovered from media conditioned by unstimulated THP-1 cells) showed little cell damage. C, Cresyl violet-stained rat hippocampus (CA3 region) after stereotaxic injections also showed far more dying, pyknotic neurons after infusion of NTox when compared with the contralateral hippocampus control infusion (D; Scale bar, 40 μm). E, Measurement of cell loss in the CA3 region after infusion of NTox in serial sections (8 μm thick) rostral and caudal to the site of injection. As shown, ∼60% neuronal loss appeared within 150 μm of the site of toxin infusion. One microliter of artificial CSF with or without NTox was injected over a 4 min period at 2.9 mm from the brain’s surface, at a distance of 4.5 mm caudal to bregma, 3.0 mm lateral to the midline into the hippocampus. We estimate ∼100 pmol of NTox were contained in the 1 μl fluid volume injected into the hippocampus.
Fig. 11.
The in vivo action of NTox can be blocked by preinfusion of 1 nmol of AP5 prepared in 1 μl artificial CSF (A) before NTox injection. In contrast, a control preinfusion with 1 μl artificial CSF did not block hippocampal injury as shown in B. Quantitative measure of CA3 neuronal damage (C) shows a 60–70% after-NTox infusion with ∼10% pyramidal cell loss seen in control injections (Student’s _t_test; p < 0.0001). Blockade with AP5 reduces cell loss to control levels. Cell counts were obtained at 100 μm rostral and caudal to the site of injection from 8-μm-thick sections stained with cresyl violet.
Similar articles
- The envelope glycoprotein of human immunodeficiency virus type 1 stimulates release of neurotoxins from monocytes.
Giulian D, Wendt E, Vaca K, Noonan CA. Giulian D, et al. Proc Natl Acad Sci U S A. 1993 Apr 1;90(7):2769-73. doi: 10.1073/pnas.90.7.2769. Proc Natl Acad Sci U S A. 1993. PMID: 8464887 Free PMC article. - Inter-relationships between quinolinic acid, neuroactive kynurenines, neopterin and beta 2-microglobulin in cerebrospinal fluid and serum of HIV-1-infected patients.
Heyes MP, Brew BJ, Saito K, Quearry BJ, Price RW, Lee K, Bhalla RB, Der M, Markey SP. Heyes MP, et al. J Neuroimmunol. 1992 Sep;40(1):71-80. doi: 10.1016/0165-5728(92)90214-6. J Neuroimmunol. 1992. PMID: 1387655 - Reactive mononuclear phagocytes release neurotoxins after ischemic and traumatic injury to the central nervous system.
Giulian D, Corpuz M, Chapman S, Mansouri M, Robertson C. Giulian D, et al. J Neurosci Res. 1993 Dec 15;36(6):681-93. doi: 10.1002/jnr.490360609. J Neurosci Res. 1993. PMID: 8145296 - The 1993 Upjohn Award Lecture. Quinolinic acid induced brain neurotransmitter deficits: modulation by endogenous excitotoxin antagonists.
Jhamandas KH, Boegman RJ, Beninger RJ. Jhamandas KH, et al. Can J Physiol Pharmacol. 1994 Dec;72(12):1473-82. doi: 10.1139/y94-213. Can J Physiol Pharmacol. 1994. PMID: 7736338 Review. - Mononuclear phagocytes mediate blood-brain barrier compromise and neuronal injury during HIV-1-associated dementia.
Persidsky Y, Zheng J, Miller D, Gendelman HE. Persidsky Y, et al. J Leukoc Biol. 2000 Sep;68(3):413-22. J Leukoc Biol. 2000. PMID: 10985259 Review.
Cited by
- Caspase cascades in human immunodeficiency virus-associated neurodegeneration.
Garden GA, Budd SL, Tsai E, Hanson L, Kaul M, D'Emilia DM, Friedlander RM, Yuan J, Masliah E, Lipton SA. Garden GA, et al. J Neurosci. 2002 May 15;22(10):4015-24. doi: 10.1523/JNEUROSCI.22-10-04015.2002. J Neurosci. 2002. PMID: 12019321 Free PMC article. - Induction of cell-cycle regulators in simian immunodeficiency virus encephalitis.
Jordan-Sciutto KL, Wang G, Murphy-Corb M, Wiley CA. Jordan-Sciutto KL, et al. Am J Pathol. 2000 Aug;157(2):497-507. doi: 10.1016/S0002-9440(10)64561-0. Am J Pathol. 2000. PMID: 10934153 Free PMC article. - Fractalkine (CX3CL1) and brain inflammation: Implications for HIV-1-associated dementia.
Cotter R, Williams C, Ryan L, Erichsen D, Lopez A, Peng H, Zheng J. Cotter R, et al. J Neurovirol. 2002 Dec;8(6):585-98. doi: 10.1080/13550280290100950. J Neurovirol. 2002. PMID: 12476352 Review. - Involvement of quinolinic acid in AIDS dementia complex.
Guillemin GJ, Kerr SJ, Brew BJ. Guillemin GJ, et al. Neurotox Res. 2005;7(1-2):103-23. doi: 10.1007/BF03033781. Neurotox Res. 2005. PMID: 15639803 Review. - Production, regulation and role of nitric oxide in glial cells.
Vincent VA, Tilders FJ, Van Dam AM. Vincent VA, et al. Mediators Inflamm. 1998;7(4):239-55. doi: 10.1080/09629359890929. Mediators Inflamm. 1998. PMID: 9792334 Free PMC article. Review. No abstract available.
References
- Abercrombie M. Estimation of nuclear population from microtome sections. Anat Rec. 1946;94:239–247. - PubMed
- Asami T, Kagechika H, Hashimoto Y, Shudo K, Miwa A, Kawai N, Nakajima T. Acylpolyamines mimic the action of Joro spider toxin (JSTX) on crustacean muscle glutamate receptors. Biomed Res. 1989;10:185–189.
- Beal MF, Swartz KJ, Hyman BT, Storey E, Finn SF. Aminooxyacetic acid results in excitotoxin lesions by a novel indirect mechanism. J Neurochem. 1991;57:1068–1073. - PubMed
Publication types
MeSH terms
Substances
LinkOut - more resources
Full Text Sources
Other Literature Sources
Medical
