Experience-dependent plasticity of binocular responses in the primary visual cortex of the mouse - PubMed (original) (raw)
Experience-dependent plasticity of binocular responses in the primary visual cortex of the mouse
J A Gordon et al. J Neurosci. 1996.
Abstract
An activity-dependent form of synaptic plasticity underlies the fine tuning of connections in the developing primary visual cortex of mammals such as the cat and monkey. Studies of the effects of manipulations of visual experience during a critical period have demonstrated that a correlation-based competitive process governs this plasticity. The cellular mechanisms underlying this competition, however, are poorly understood. Transgenic and gene-targeting technologies have led to the development of a new category of reagents that have the potential to help answer questions of cellular mechanism, provided that the questions can be studied in a mouse model. The current study attempts to characterize a developmental plasticity in the mouse primary visual cortex and to demonstrate its relevance to that found in higher mammals. We found that 4 d of monocular lid suture at postnatal day 28 (P28) induced a maximal loss of responsiveness of cortical neurons to the deprived eye. These ocular dominance shifts occurred during a well-defined critical period, between P19 and P32. Furthermore, binocular deprivation during this critical period did not decrease visual cortical responses, and alternating monocular deprivation resulted in a decrease in the number of binocularly responsive neurons. Finally, a laminar analysis demonstrated plasticity of both geniculocortical and intracortical connections. These results demonstrate that an activity-dependent, competitive form of synaptic plasticity that obeys correlation-based rules operates in the developing primary visual cortex of the mouse.
Figures
Fig. 3.
Ocular dominance of cells within the binocular zone. A_–_C, Relationship between OD and RF location in ND (A, C) and MD (B,C) mice. A, B, OD scores of 320 cells from nine ND mice (A) and 234 cells from 10 MD mice (B) are plotted versus the azimuth of the RF center of each cell. Cells from the MD animals were recorded in the cortex contralateral to the deprived eye. C, The CBI was calculated separately for cells with RF center azimuths of −5 to 5, 6–15, 16–25, 26–40, and >40° from the vertical meridian in ND mice (circles), and −5 to 5, 6–15, and 16–25° in MD mice (triangles). MD mice were deprived for 4 d beginning at either P23 or P27. For each point, n = 59–134 cells, except for ND 26–40°, n = 17; ND > 40°, n = 6; and MD 16–25°, n = 13.
Fig. 1.
The primary visual cortex of the mouse.A, Schematic diagram of the central visual pathway in the mouse. The central 30–40° of the upper portion of each visual hemifield is seen by the retinas of both eyes. Retinal ganglion cell axons project to eye-specific regions of the LGN. Geniculocortical projections carrying information from the two eyes converge in the lateral one third of the primary visual cortex (V1), in the binocular zone. Arrow indicates vertical meridian of the visual field.B, Diagram showing the locations of a series of penetrations made into the visual cortex of a normal mouse. Thin circles_show penetrations in the monocular portion of V1. Thick circles show penetrations in the binocular zone of V1.Dashed circle shows a penetration made into V2.C, Retinotopy in the visual cortex of a normal mouse. Representative RFs encountered in the penetrations shown in_B are plotted here. The numbers correspond to the penetrations in which the RFs were found. Within V1, moving the electrode laterally (toward the right in B) resulted in finding more centrally located RFs (toward the_right_ in C). Once the electrode was moved into V2, the retinotopic progression reversed itself, as lateral displacement of the electrode resulted in a peripheral shift in RF position. This reversal of retinotopy was used during recording to determine the location of the V1/V2 boundary. The dashed line is the vertical meridian.
Fig. 9.
Reconstruction of an electrode track for laminar analysis. A, Nissl-stained section of the visual cortex in a deprived mouse. Two lesions placed at the end of a penetration into the binocular zone can be seen. B, Camera lucida drawing of section shown in A. Laminar boundaries are drawn, as are the lesions and the electrode track. The locations of each cell encountered in the penetration are indicated by hash marks across the electrode track. OD scores are shown to the right of each hash mark for those neurons that could be unambiguously assigned to a cortical layer; numbers to the left of selected hash marks indicated the neurons from which the RFs shown in C were obtained. The scale bar and direction key apply to both _A_and B. C, RFs of selected cells obtained in the penetration depicted in A and B. Note that because the electrode penetration was not radial, there was a gradual progression in RF position toward more central locations as the electrode was advanced deeper into the cortex. The vertical meridian is indicated by the dashed line.
Fig. 2.
Effects of monocular deprivation on ocular dominance in mouse primary visual cortex. Top, Distribution of OD scores (see Results) for 27 neurons recorded from the binocular zone of a normal P24 mouse. Lower left, OD distribution for 26 neurons recorded in the binocular zone ipsilateral to the deprived eye in a mouse that underwent MD from P28 to P32. Lower right, OD distribution for 25 neurons from the binocular zone contralateral to the deprived eye; same mouse as lower left. The CBI (see Materials and Methods) is indicated in the upper right corner of each histogram. The number of neurons of each OD class is indicated at the top of each_bar_.
Fig. 4.
Critical period for the effects of monocular deprivation in the mouse. Mean ± SD CBIs for normal animals (shaded bar) and animals monocularly deprived for 4 d beginning at various ages (filled triangles). Filled circles show individual CBIs for OD distributions obtained from ND animals; n = 23–30 cells per hemisphere, N = five hemispheres from five animals per time point (MD) and six hemispheres from five animals (ND).
Fig. 5.
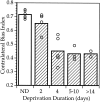
Duration of monocular deprivation required for maximal shift. CBIs were calculated individually from OD distributions obtained from nondeprived mice and mice deprived for increasing lengths of time, centered at ∼P28. Mean (bars) and individual CBIs (open circles) are shown.
Fig. 6.
Effects of binocular deprivation on visual cortical responses in the mouse. A, RF sizes in BD and normal mice. The mean ± SD is shown for RFs of neurons recorded in each animal (mo105 to mo326). The overall mean ± SEM are shown for all four BD animals (All BD) and all five ND animals (All ND); n = 15–54 cells per animal, n = 137 and 124 cells for All BD and All ND, respectively. B, Retinotopy in BD and normal animals. Series of three to five evenly spaced penetrations were made across a portion of the lateromedial extent of V1 in BD and ND animals. The RF centers of three to five neurons encountered at each location are plotted here for one representative series of penetrations from a BD (circles) and an ND animal (triangles).Solid and dotted lines show linear regressions of RF center azimuth on electrode position in the BD and normal animal, respectively. Inset shows mean ± SD correlation coefficients of two and four regressions each from BD and normal animals, respectively. C, OD distribution of 132 neurons recorded from the binocular zone in the BD mice. Conventions as in Figure 2. The OD distribution for ND animals is shown in Figure8_A_. D, Visual evoked responses in single neurons recorded from the binocular zone in ND, BD, and_MD_ mice. Mean ± SEM of responses of neurons to computer-generated stimuli presented to both eyes (gray bars), the ipsilateral eye (white bars), or the contralateral eye (hatched bars) are shown. Responses are calculated separately for neurons recorded contralateral (contra MD) and ipsilateral (ipsi MD) to the deprived eye. For each neuron, the response to eight presentations (four in each direction) of a bar of each orientation were averaged; n = 11–24 cells for each category. Both MD and BD mice were deprived from P28 to P32.
Fig. 8.
Effects of alternating monocular deprivation on binocular responses. A_–_D, OD distributions for cells recorded from mice subjected to various manipulations of their visual experience. Conventions as in Figure 2. A, ND mice; 150 cells were recorded from six hemispheres in five animals.B, AltMD. Mice were initially deprived of vision in one eye from P22 or P23 to P29, then subjected to daily AltMD for 7–12 d; 257 cells were recorded from the hemisphere contralateral to the initially deprived eye in five mice. C, Contralateral MD; 130 cells were recorded from the hemisphere contralateral to the deprived eye in five MD mice deprived from P28 to P32. D, Ipsilateral MD; 91 cells were recorded from the hemisphere ipsilateral to the deprived eye in five MD mice.
Fig. 7.
Orientation tuning of neurons in binocularly deprived mice. A, An orientation-selective cell.B, A cell with weak orientation tuning. Averaged responses to four presentations of an oriented bar moving in the indicated direction are shown for each of four orientations (two directions each). S indicates spontaneous activity. Both neurons were recorded within the binocular zone of a mouse deprived binocularly from P28 to P32.
Fig. 10.
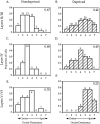
Laminar analysis of binocular responses in nondeprived and monocularly deprived mice. A_–_F, OD histograms are shown for cells recorded from ND (A,C, E) and MD (B, D,F) mice separated by cortical layer. MD animals were deprived contralaterally for 4 d beginning between P23 and P28. Conventions as in Figure 2.
Fig. 11.
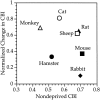
Relationship between initial contralateral bias and the degree of shift induced by MD. The normalized change in CBI with deprivation of the contralateral eye are plotted as a function of the initial CBI in ND animals for seven different species. The normalized change in CBI is calculated as (CBI in normal animals − CBI in deprived animals)/CBI in normal animals. Sources are as follows: sheep, Kennedy et al., 1980; hamster, Emerson et al., 1982; rat, Maffei et al., 1992; cat, Wiesel and Hubel, 1963; monkey, Hubel et al., 1977; rabbit, Van Sluyters and Stewart, 1974.
Similar articles
- Binocular input coincidence mediates critical period plasticity in the mouse primary visual cortex.
Chen XJ, Rasch MJ, Chen G, Ye CQ, Wu S, Zhang XH. Chen XJ, et al. J Neurosci. 2014 Feb 19;34(8):2940-55. doi: 10.1523/JNEUROSCI.2640-13.2014. J Neurosci. 2014. PMID: 24553935 Free PMC article. - Retinoic Acid Receptor RARα-Dependent Synaptic Signaling Mediates Homeostatic Synaptic Plasticity at the Inhibitory Synapses of Mouse Visual Cortex.
Zhong LR, Chen X, Park E, Südhof TC, Chen L. Zhong LR, et al. J Neurosci. 2018 Dec 5;38(49):10454-10466. doi: 10.1523/JNEUROSCI.1133-18.2018. Epub 2018 Oct 24. J Neurosci. 2018. PMID: 30355624 Free PMC article. - Anatomical correlates of functional plasticity in mouse visual cortex.
Antonini A, Fagiolini M, Stryker MP. Antonini A, et al. J Neurosci. 1999 Jun 1;19(11):4388-406. doi: 10.1523/JNEUROSCI.19-11-04388.1999. J Neurosci. 1999. PMID: 10341241 Free PMC article. - Comparison of plasticity in vivo and in vitro in the developing visual cortex of normal and protein kinase A RIbeta-deficient mice.
Hensch TK, Gordon JA, Brandon EP, McKnight GS, Idzerda RL, Stryker MP. Hensch TK, et al. J Neurosci. 1998 Mar 15;18(6):2108-17. doi: 10.1523/JNEUROSCI.18-06-02108.1998. J Neurosci. 1998. PMID: 9482797 Free PMC article. Review. - Circuitry Underlying Experience-Dependent Plasticity in the Mouse Visual System.
Hooks BM, Chen C. Hooks BM, et al. Neuron. 2020 Apr 8;106(1):21-36. doi: 10.1016/j.neuron.2020.01.031. Neuron. 2020. PMID: 32272065 Free PMC article. Review.
Cited by
- Impact of transcranial Direct Current Stimulation on stereoscopic vision and retinal structure in adult amblyopic rodents.
Martinez-Navarrete G, Castaño-Castaño S, Morales-Navas M, Nieto-Escámez F, Sánchez-Santed F, Fernandez E. Martinez-Navarrete G, et al. Eye Brain. 2024 Oct 31;16:75-88. doi: 10.2147/EB.S474573. eCollection 2024. Eye Brain. 2024. PMID: 39498234 Free PMC article. - Glial Control of Cortical Neuronal Circuit Maturation and Plasticity.
Faust TE, Devlin BA, Farhy-Tselnicker I, Ferro A, Postolache M, Xin W. Faust TE, et al. J Neurosci. 2024 Oct 2;44(40):e1208242024. doi: 10.1523/JNEUROSCI.1208-24.2024. J Neurosci. 2024. PMID: 39358028 Review. - Oligodendrocytes and myelin limit neuronal plasticity in visual cortex.
Xin W, Kaneko M, Roth RH, Zhang A, Nocera S, Ding JB, Stryker MP, Chan JR. Xin W, et al. Nature. 2024 Sep;633(8031):856-863. doi: 10.1038/s41586-024-07853-8. Epub 2024 Aug 21. Nature. 2024. PMID: 39169185 Free PMC article. - A dendritic mechanism for balancing synaptic flexibility and stability.
Yaeger CE, Vardalaki D, Zhang Q, Pham TLD, Brown NJ, Ji N, Harnett MT. Yaeger CE, et al. Cell Rep. 2024 Aug 27;43(8):114638. doi: 10.1016/j.celrep.2024.114638. Epub 2024 Aug 19. Cell Rep. 2024. PMID: 39167486 Free PMC article. - The noncoding circular RNA circHomer1 regulates developmental experience-dependent plasticity in mouse visual cortex.
Jenks KR, Cai Y, Nayan ME, Tsimring K, Li K, Zepeda JC, Heller GR, Delepine C, Shih J, Yuan S, Zhu Y, Wang Y, Duan Y, Fu AKY, Ku T, Yun DH, Chung K, Zhang C, Boyden ES, Mellios N, Sur M, Kan Ip JP. Jenks KR, et al. bioRxiv [Preprint]. 2024 Jul 24:2024.07.19.603416. doi: 10.1101/2024.07.19.603416. bioRxiv. 2024. PMID: 39091722 Free PMC article. Preprint.
References
- Antonini A, Stryker MP. Rapid remodeling of axonal arbors in the visual cortex. Science. 1993b;260:1819–1821. - PubMed
- Blakemore C. Development of cat visual cortex following rotation of one eye. Nature. 1975;257:584–586. - PubMed
Publication types
MeSH terms
LinkOut - more resources
Full Text Sources
Other Literature Sources
Research Materials
Miscellaneous


