Torsional rigidity of single actin filaments and actin-actin bond breaking force under torsion measured directly by in vitro micromanipulation - PubMed (original) (raw)
Torsional rigidity of single actin filaments and actin-actin bond breaking force under torsion measured directly by in vitro micromanipulation
Y Tsuda et al. Proc Natl Acad Sci U S A. 1996.
Abstract
Knowledge of the elastic properties of actin filaments is crucial for considering its role in muscle contraction, cellular motile events, and formation of cell shape. The stiffness of actin filaments in the directions of stretching and bending has been determined. In this study, we have directly determined the torsional rigidity and breaking force of single actin filaments by measuring the rotational Brownian motion and tensile strength using optical tweezers and microneedles, respectively. Rotational angular fluctuations of filaments supplied the torsional rigidity as (8.0 +/- 1.2) x 10(-26) Nm2. This value is similar to that deduced from the longitudinal rigidity, assuming the actin filament to be a homogeneous rod. The breaking force of the actin-actin bond was measured while twisting a filament through various angles using microneedles. The breaking force decreased greatly under twist, e.g., from 600-320 pN when filaments were turned through 90 degrees, independent of the rotational direction. Our results indicate that an actin filament exhibits comparable flexibility in the rotational and longitudinal directions, but breaks more easily under torsional load.
Figures
Figure 2
Measurement of the rotational Brownian motion of the bead and its actin tail. (a) Schematic representation of the measurement (not drawn to scale, see text for details). Optical tweezers act as a frictionless bearing for a trapped bead, so that free rotation of the actin filament can be observed while the filament is maintained under moderate tension (see Fig. 1). (b) Fluorescent images of the bead, tagged with fluorescent microbeads and bearing an actin filament tail, undergoing motion. The plane of projection is parallel to that of the coverslip, i.e., perpendicular to the actin filament axis (see Materials and Methods). Images taken every 2 s are shown.
Figure 1
Thermal rotational diffusion of beads without an actin tail caught in an optical tweezers. Rotational angles of trapped beads were determined by measuring the position of fluorescent microbeads (0.01 μm in diameter) projected on the two dimensional photosensor plane (see Fig. 2_b_). The laser power measured before introduced into the objective lens was 10 mW. A solid line indicates that theoretically expected for a free bead of 2 μm in diameter in solution (see Materials and Methods for details). Three symbols (•, ▴, and ▾) are for three different beads.
Figure 3
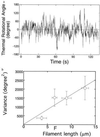
(a) Rotational angular fluctuation of a bead attached to a 10-μm actin filament. Data points were taken every six frames (0.2 s). The rotational relaxation time (ξ/κ) obtained from the autocorrelation function of the data taken at a sampling time of 0.066 s was 2.7 s, and this is ≈14-fold shorter than the above sampling time. This rotational relaxation time is consistent with that estimated from the torsional rigidity obtained later from the variance in rotational angle (κ) and the theoretical value of the rotational frictional drag coefficient for a free bead (2 μm in diameter) in water (ξ) (see ref. 32). (b) Variance in rotational angle as a function of the length of an actin filament. Each vertical bar indicates SEM for 8 to 12 filaments. Each horizontal bar indicates the range of filament lengths, in which variance was averaged. A solid line indicates the least squares fit of the data. Data recorded for >180 s were used for analysis of each filament. The sampling time was 0.2–1 s. The results were hardly dependent of the sampling time in this range. Experiments were performed in a solution containing 25 mM KCl, 5 mM MgCl2, 2 mM ATP, 20 mM Hepes (pH 7.8), and an oxygen scavenging system (24) at 25 ± 2°C.
Figure 4
(a) Schematic representation of the measurement of tensile strength. Manipulation of an actin filament and the measurement of tensile strength were performed as described (23). The actin filament was twisted by rotating the stiff needle with a stepper motor. θB is the rotational angle of the actin filament undergoing the rotation under no tension, and θN is the angle of the filament rotated by the needle. The stiffness of glass needles was calibrated as described (3, 23). (b) Average tensile strengths of single actin filaments when twisted clock wise (+) and counter clock wise (−). The length of filaments used was 10 ± 2 μm. Experiments were performed in the same solution described in the Fig. 2 legend. Temperature = 25 ± 2°C. Bars = SD for 20–150 filaments.
Figure 5
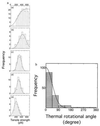
Histograms of tensile strength of single actin filaments twisted by 0° (a), 45° (b), 90° (c), 180° (d), and 360° (e). (f) Distribution of thermal rotational angles. The histogram at twist angle θN = 0° (Fig. 4_a_) was replotted against the thermal rotational angle, using the relationship between the tensile strength and the twist angle. Each bar shows the number per 45° interval. A solid line indicates the best fit of the data to a Boltzmann distribution,N =N_0exp(−κ/2_k_B_TL), with κ = 6.7 × 10⁻²⁶ Nm2 and_L_ = 10 μm.
Similar articles
- Direct measurement of the torsional rigidity of single actin filaments.
Yasuda R, Miyata H, Kinosita K Jr. Yasuda R, et al. J Mol Biol. 1996 Oct 25;263(2):227-36. doi: 10.1006/jmbi.1996.0571. J Mol Biol. 1996. PMID: 8913303 - Twist response of actin filaments.
Bibeau JP, Pandit NG, Gray S, Shatery Nejad N, Sindelar CV, Cao W, De La Cruz EM. Bibeau JP, et al. Proc Natl Acad Sci U S A. 2023 Jan 24;120(4):e2208536120. doi: 10.1073/pnas.2208536120. Epub 2023 Jan 19. Proc Natl Acad Sci U S A. 2023. PMID: 36656858 Free PMC article. - Force measurements by micromanipulation of a single actin filament by glass needles.
Kishino A, Yanagida T. Kishino A, et al. Nature. 1988 Jul 7;334(6177):74-6. doi: 10.1038/334074a0. Nature. 1988. PMID: 3386748 - Muscle force arises by actin filament rotation and torque in the Z-filaments.
Jarosch R. Jarosch R. Biochem Biophys Res Commun. 2000 Apr 21;270(3):677-82. doi: 10.1006/bbrc.1999.1971. Biochem Biophys Res Commun. 2000. PMID: 10772883 Review. - Special Issue: The Actin-Myosin Interaction in Muscle: Background and Overview.
Squire J. Squire J. Int J Mol Sci. 2019 Nov 14;20(22):5715. doi: 10.3390/ijms20225715. Int J Mol Sci. 2019. PMID: 31739584 Free PMC article. Review.
Cited by
- Cryo-EM Structure of Actin Filaments from Zea mays Pollen.
Ren Z, Zhang Y, Zhang Y, He Y, Du P, Wang Z, Sun F, Ren H. Ren Z, et al. Plant Cell. 2019 Dec;31(12):2855-2867. doi: 10.1105/tpc.18.00973. Epub 2019 Oct 18. Plant Cell. 2019. PMID: 31628168 Free PMC article. - Like-charge attraction between polyelectrolytes induced by counterion charge density waves.
Angelini TE, Liang H, Wriggers W, Wong GC. Angelini TE, et al. Proc Natl Acad Sci U S A. 2003 Jul 22;100(15):8634-7. doi: 10.1073/pnas.1533355100. Epub 2003 Jul 9. Proc Natl Acad Sci U S A. 2003. PMID: 12853566 Free PMC article. - Resource Letter: LBOT-1: Laser-based optical tweezers.
Lang MJ, Block SM. Lang MJ, et al. Am J Phys. 2003 Mar;71(3):201-215. doi: 10.1119/1.1532323. Am J Phys. 2003. PMID: 16971965 Free PMC article. - Response of an actin filament network model under cyclic stretching through a coarse grained Monte Carlo approach.
Kang J, Steward RL, Kim Y, Schwartz RS, LeDuc PR, Puskar KM. Kang J, et al. J Theor Biol. 2011 Apr 7;274(1):109-19. doi: 10.1016/j.jtbi.2011.01.011. Epub 2011 Jan 15. J Theor Biol. 2011. PMID: 21241710 Free PMC article. - Cofilin changes the twist of F-actin: implications for actin filament dynamics and cellular function.
McGough A, Pope B, Chiu W, Weeds A. McGough A, et al. J Cell Biol. 1997 Aug 25;138(4):771-81. doi: 10.1083/jcb.138.4.771. J Cell Biol. 1997. PMID: 9265645 Free PMC article.
References
- Oosawa F. Biorheology. 1977;14:11–19. - PubMed
- Egelman E H. J Muscle Res Cell Motil. 1985;6:129–151. - PubMed
MeSH terms
Substances
LinkOut - more resources
Full Text Sources


